
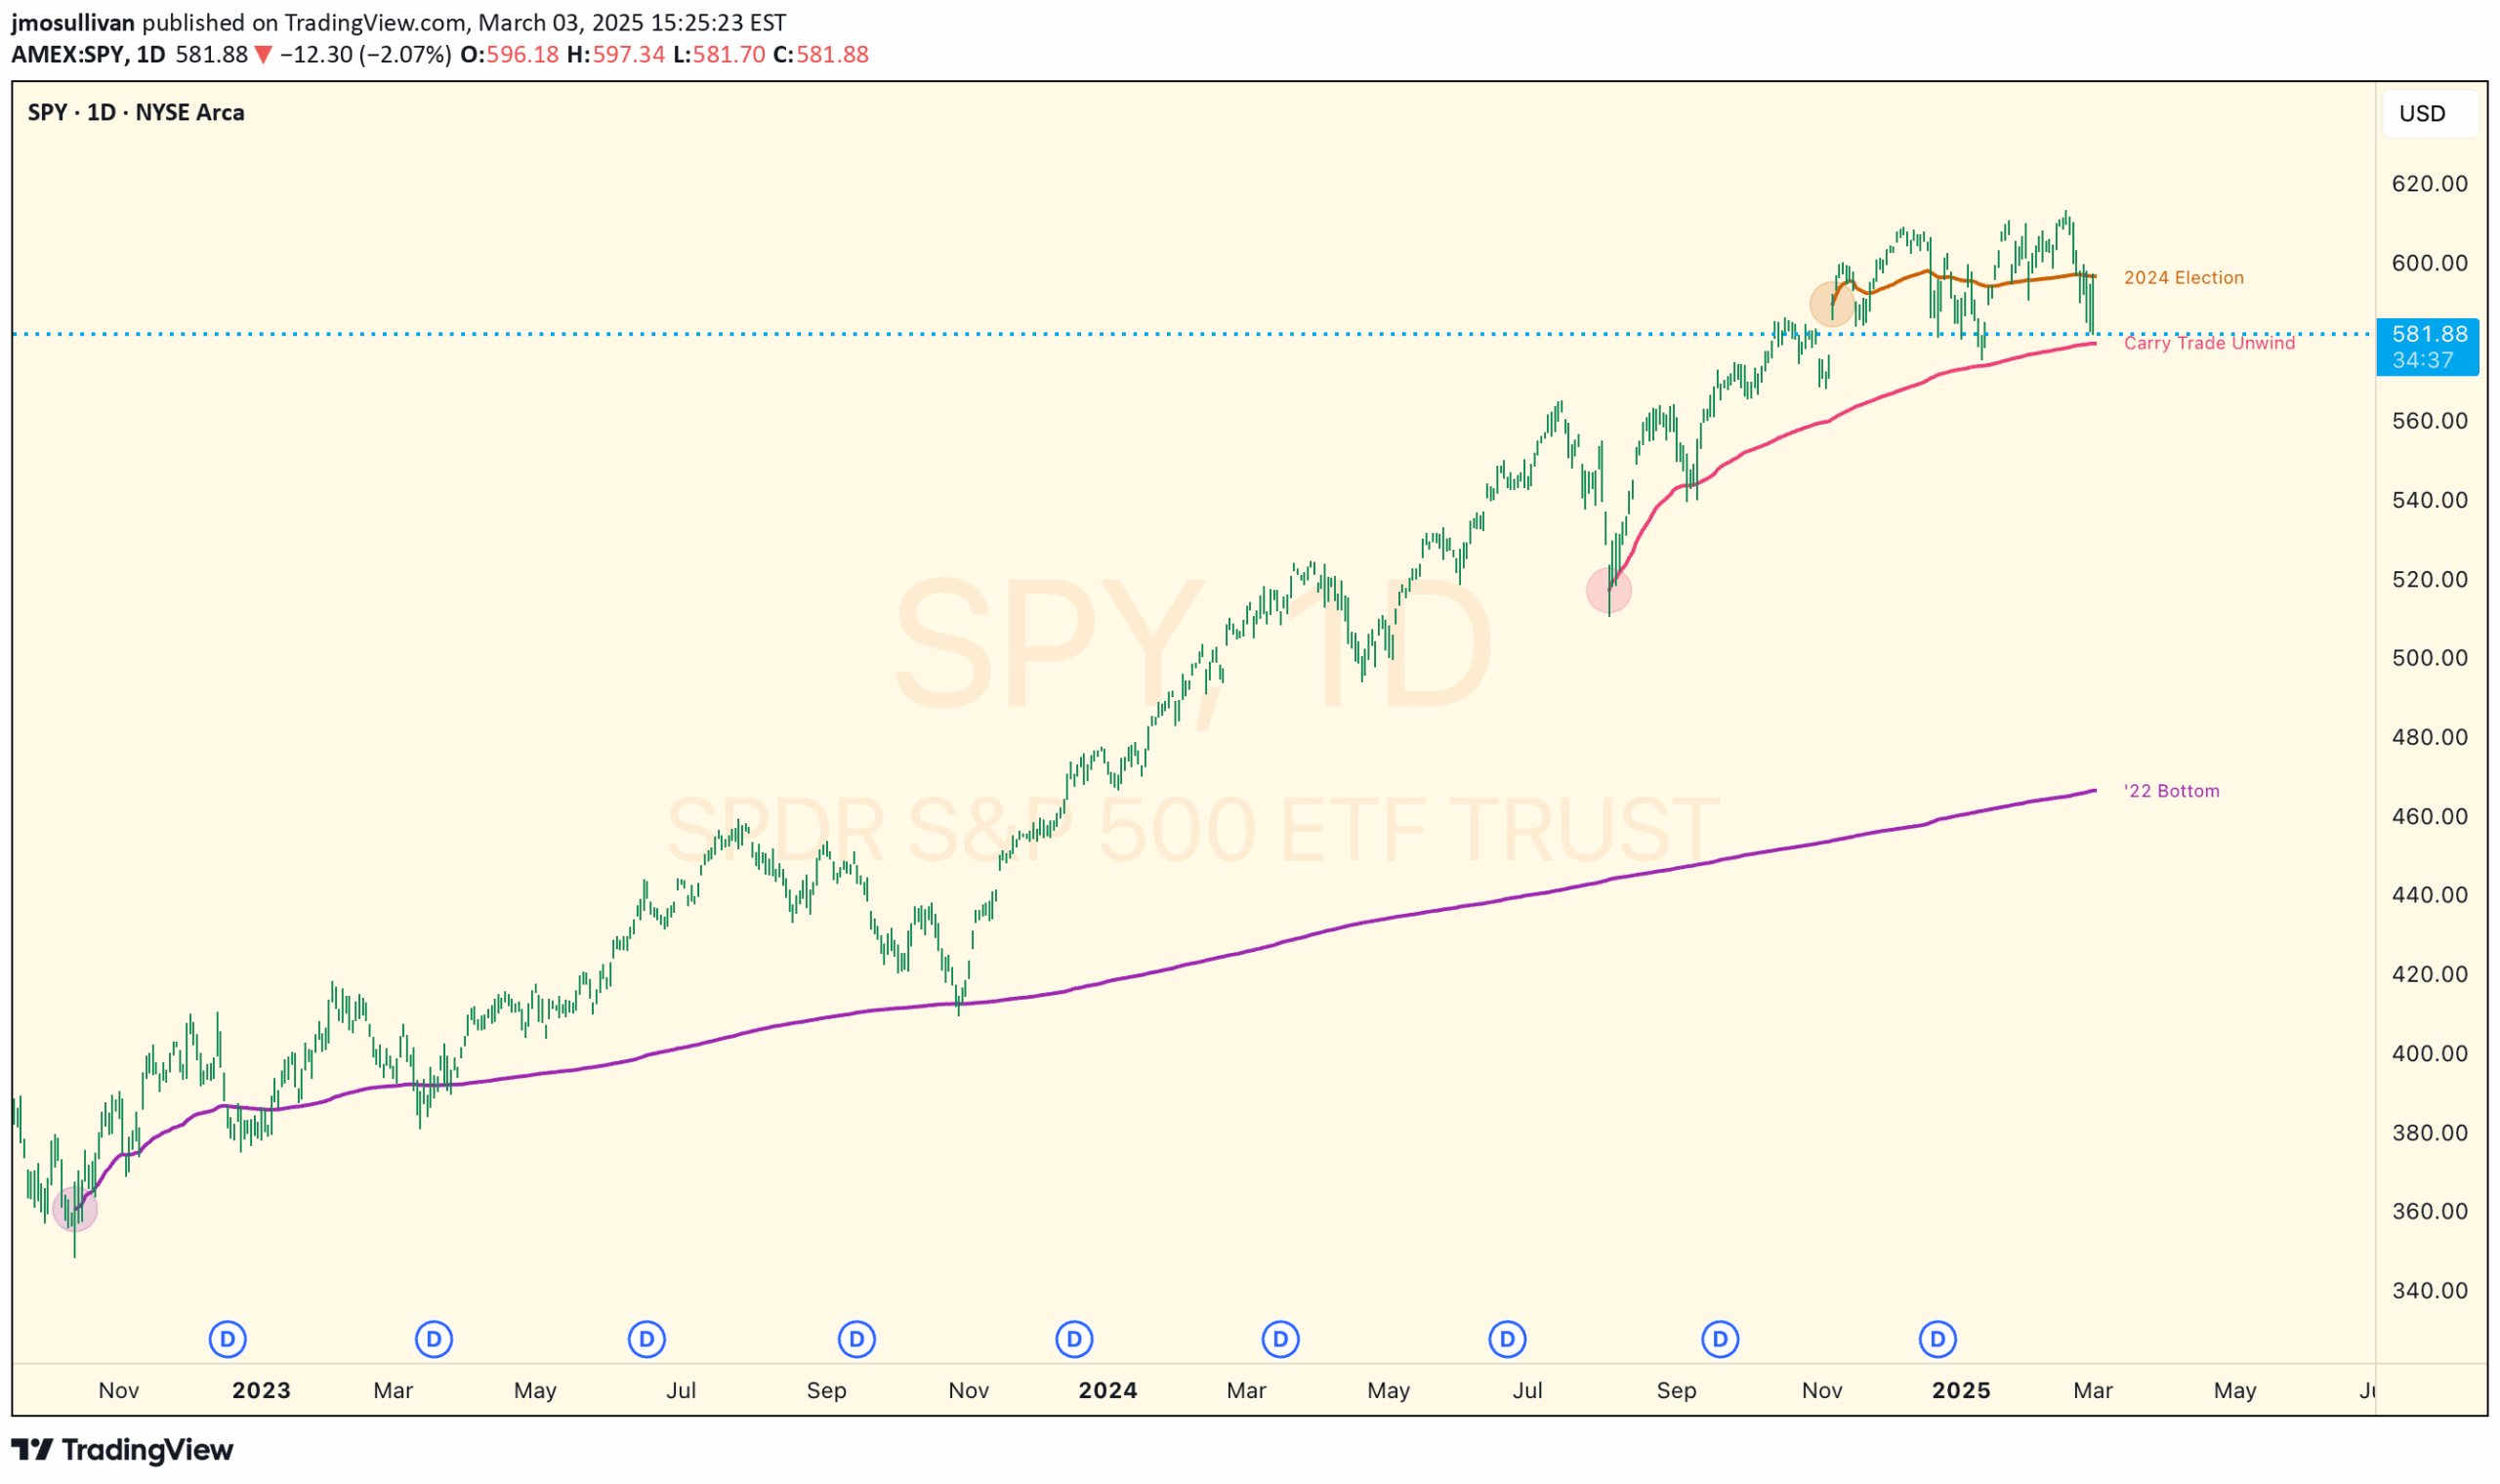
Anchored VWAP plots with customizable labels that help traders track and annotate key market moments across multiple charts and timeframes.
Explore complementary indicator rolesHow it works
Anchored VWAP (Volume Weighted Average Price) plots are created by selecting a specific reference point on a chart and calculating a weighted average price from that moment. The indicator allows users to place labels directly on these plots, providing context and meaning to the specific market moments being tracked.
Unlike standard VWAP tools, this version enables traders to add descriptive text to their plots, making it easier to remember and understand the significance of different price levels. The plots can be configured to appear across multiple symbols or limited to specific securities, offering flexibility in tracking market events.
Why it may be useful
Traditional VWAP tools require traders to rely on visual styles like color or line thickness to convey meaning, which can be confusing and prone to misinterpretation. By allowing direct labeling, traders can quickly understand the context of key market moments without needing to remember complex visual coding systems.
The ability to create persistent, labeled VWAP plots across different charts helps traders maintain a consistent view of significant market events. This approach enhances analytical clarity and provides a more intuitive method for tracking and interpreting price dynamics across various timeframes and market conditions.
When to explore it
Anchored VWAP plots with labels are most effective during periods of significant market transitions, such as identifying market bottoms, tracking important economic events, or marking key trend reversals. Traders can use these plots to highlight moments like major economic shifts, sector rotations, or specific price levels that represent critical turning points.
The tool is particularly useful for traders who want to maintain a comprehensive view of market context across multiple securities. By creating easily recognizable and labeled reference points, traders can quickly assess historical price behavior and potential future market movements with greater precision and understanding.
Keep exploring
What we’ve verified
Access, alerts and repainting behaviour have not been independently verified for this indicator. Check the creator’s current publication and settings.
General descriptions and classifications are recovered research. Verified details above identify the specific checks we have completed. Check the creator’s current publication for later changes.


