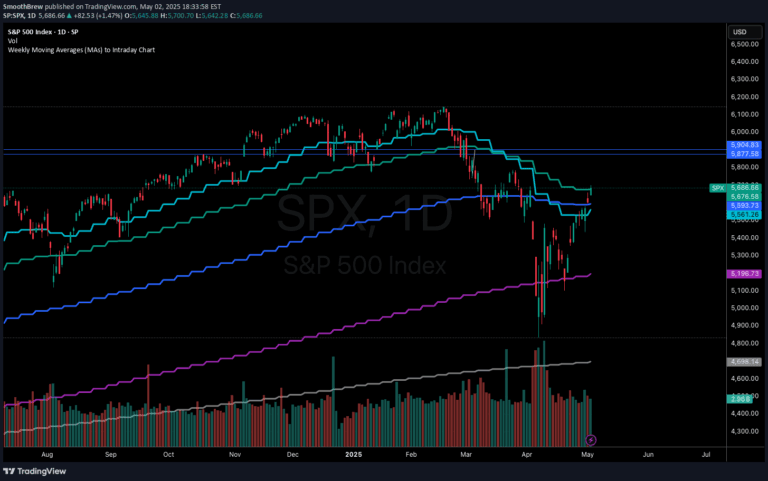
A multi-indicator script tracking multiple moving averages, premarket levels, and previous day's high/low points to enhance technical analysis and price action understanding.
Explore complementary indicator rolesHow it works
This script allows traders to simultaneously display multiple technical indicators on a single chart, focusing on moving averages like EMA and SMA across different timeframes. It dynamically tracks and plots premarket high and low points, as well as the previous trading day's high and low levels, providing a comprehensive view of price action potential support and resistance zones.
The script intelligently adapts to different timeframes, allowing EMA indicators on lower timeframes and SMA indicators on higher timeframes. By integrating these various technical markers, traders can gain a more nuanced understanding of market dynamics and potential price movement directions.
Why it may be useful
Technical indicators are crucial for understanding market trends, momentum, and potential price reversal points. By consolidating multiple indicators and reference levels into a single chart, traders can make more informed decisions about market entry and exit points.
The multi-layered approach helps traders identify key support and resistance levels, understand price action context, and develop more sophisticated trading strategies. Tracking premarket and previous day's levels provides additional insights into potential market sentiment and directional biases.
When to explore it
This indicator is most effective during active trading sessions, particularly for day traders and scalpers who require rapid, comprehensive market analysis. It works best in liquid markets with clear trend characteristics, such as major stock indices, forex pairs, and actively traded commodities.
Traders should utilize this script when seeking a holistic view of market conditions, looking to confirm trend strength, identify potential support/resistance zones, and make quick, data-driven trading decisions. It is particularly valuable during periods of market volatility or when multiple technical signals need simultaneous evaluation.
Keep exploring
What we’ve verified
Access, alerts and repainting behaviour have not been independently verified for this indicator. Check the creator’s current publication and settings.
General descriptions and classifications are recovered research. Verified details above identify the specific checks we have completed. Check the creator’s current publication for later changes.