
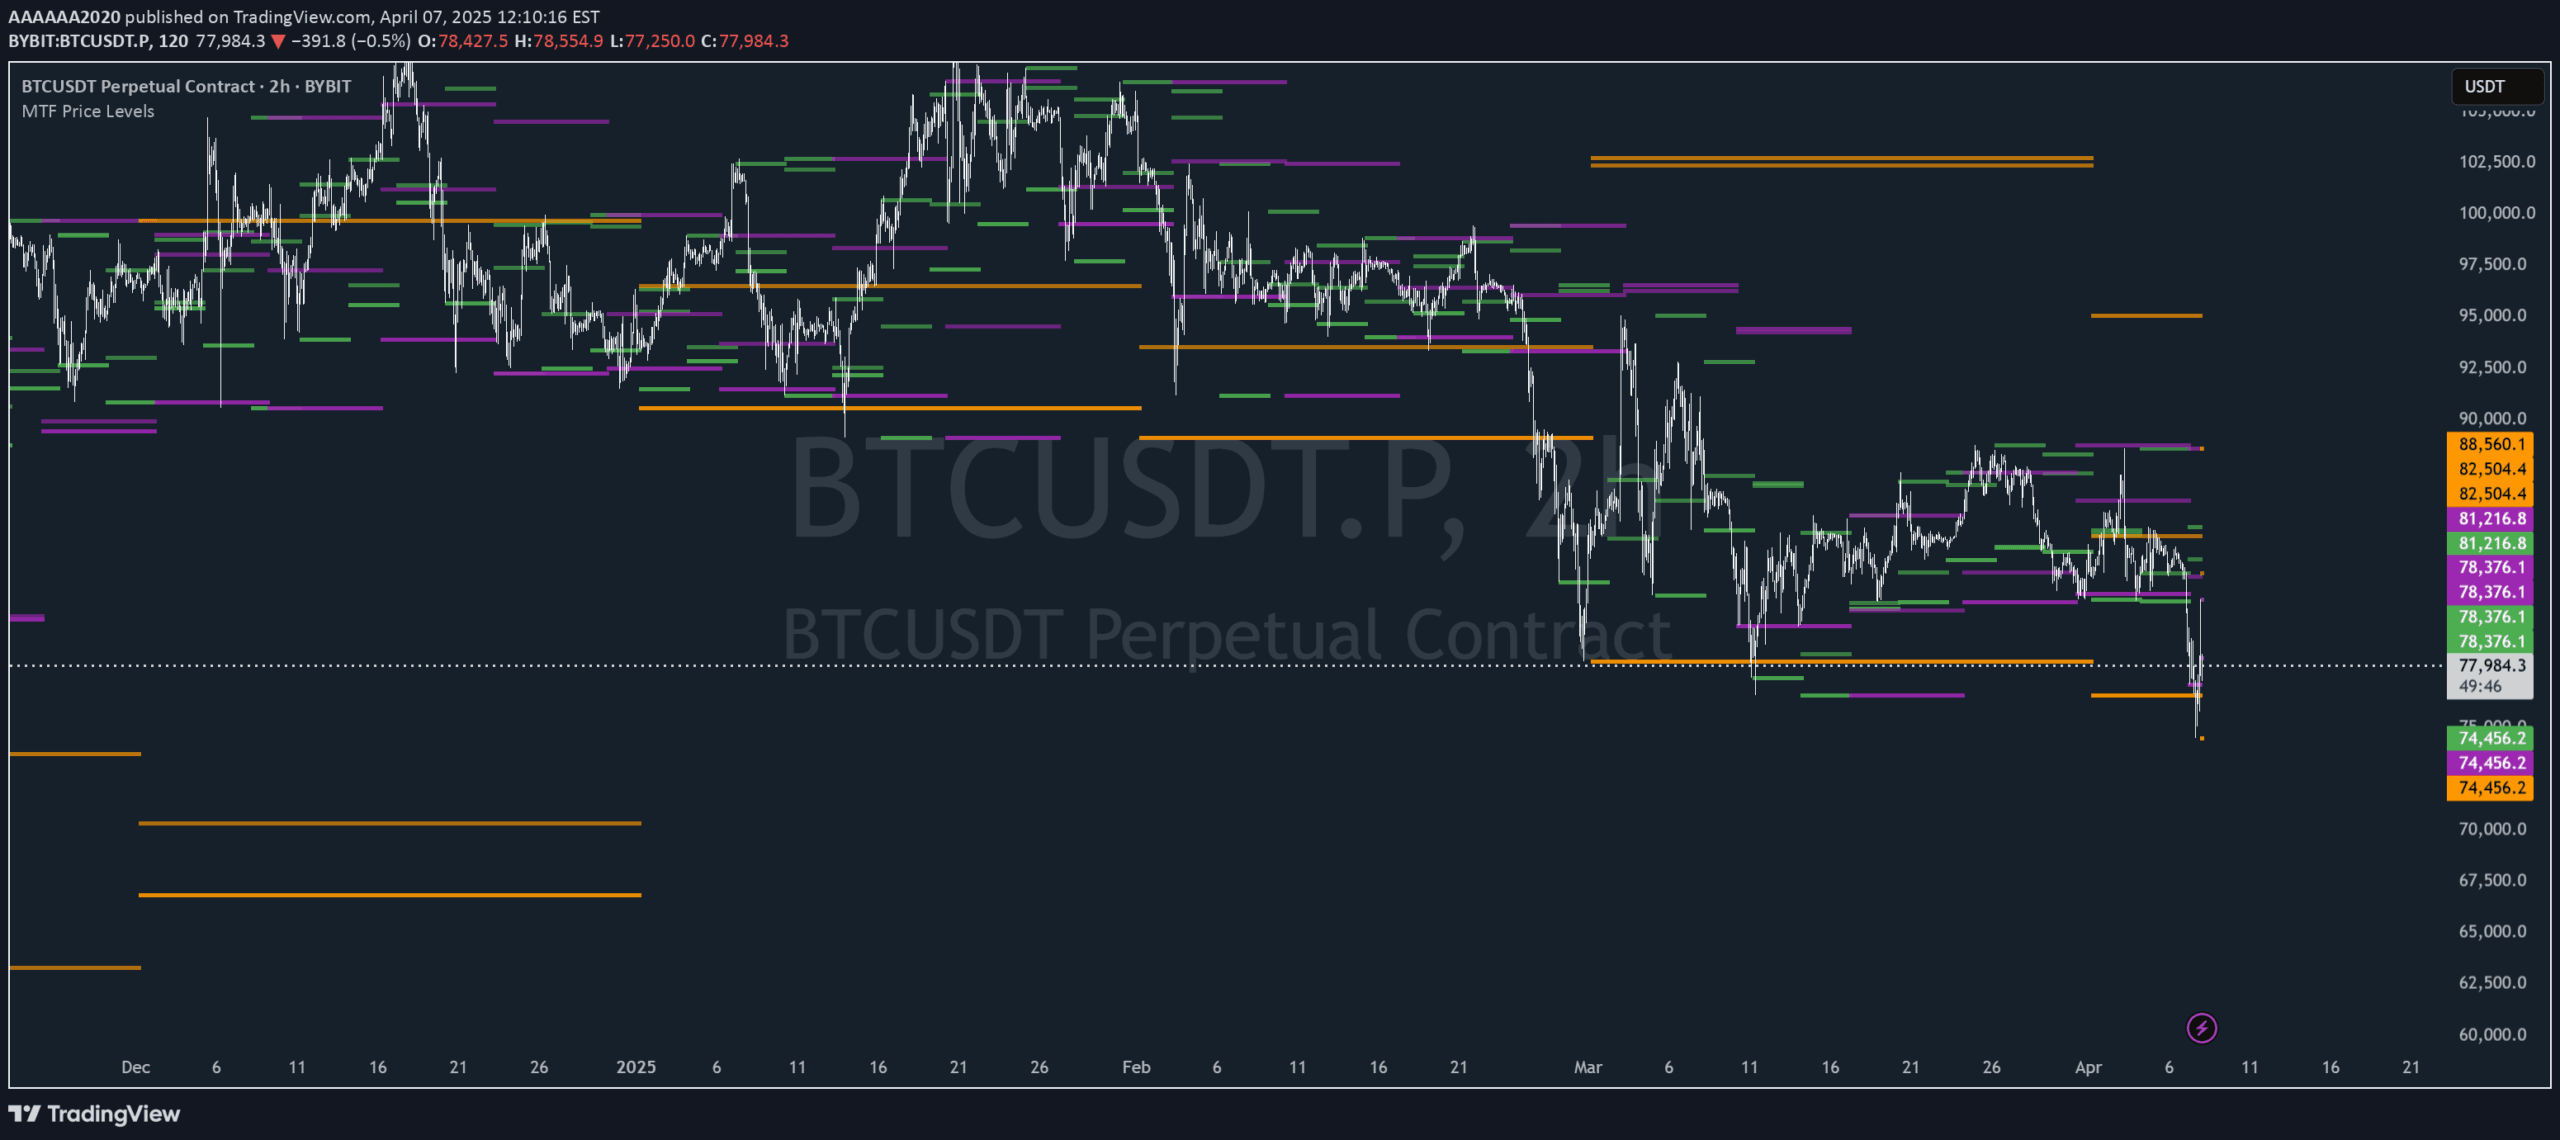
A multi-timeframe price level indicator that reveals key support and resistance zones across different chart timeframes, helping traders identify significant price regions for strategic trading decisions.
Explore complementary indicator rolesHow it works
This indicator analyzes price levels from multiple timeframes including 4H, Daily, 3-Day, Weekly, and Monthly charts. It plots key price points such as Open, Close, High, and Low for each timeframe.
Each timeframe is color-coded for easy visual identification, with varying transparency levels that help distinguish between different price types. The indicator allows traders to customize which timeframes and price types they want to display, creating a flexible and comprehensive view of potential support and resistance zones
Why it may be useful
Multi-timeframe analysis provides traders with a more comprehensive market perspective by revealing price dynamics across different time horizons. By identifying converging price levels, traders can develop more robust trading strategies with higher probability setups.
The color-coded and transparent display makes it easy to quickly interpret complex price information. This approach helps traders confirm potential entry and exit points, set more strategic stop losses, and understand the broader market context beyond single-timeframe analysis
When to explore it
This indicator works best when traders want to confirm multiple timeframe confluences and identify strong support/resistance zones. It is particularly useful during range-bound markets or when prices are approaching significant historical levels.
Traders can leverage this tool for swing trading and longer-term position sizing, where understanding broader market structures is crucial. It is most effective when combined with other technical analysis tools and used alongside a comprehensive trading strategy that considers multiple market factors
Keep exploring
What we’ve verified
Access, alerts and repainting behaviour have not been independently verified for this indicator. Check the creator’s current publication and settings.
General descriptions and classifications are recovered research. Verified details above identify the specific checks we have completed. Check the creator’s current publication for later changes.


