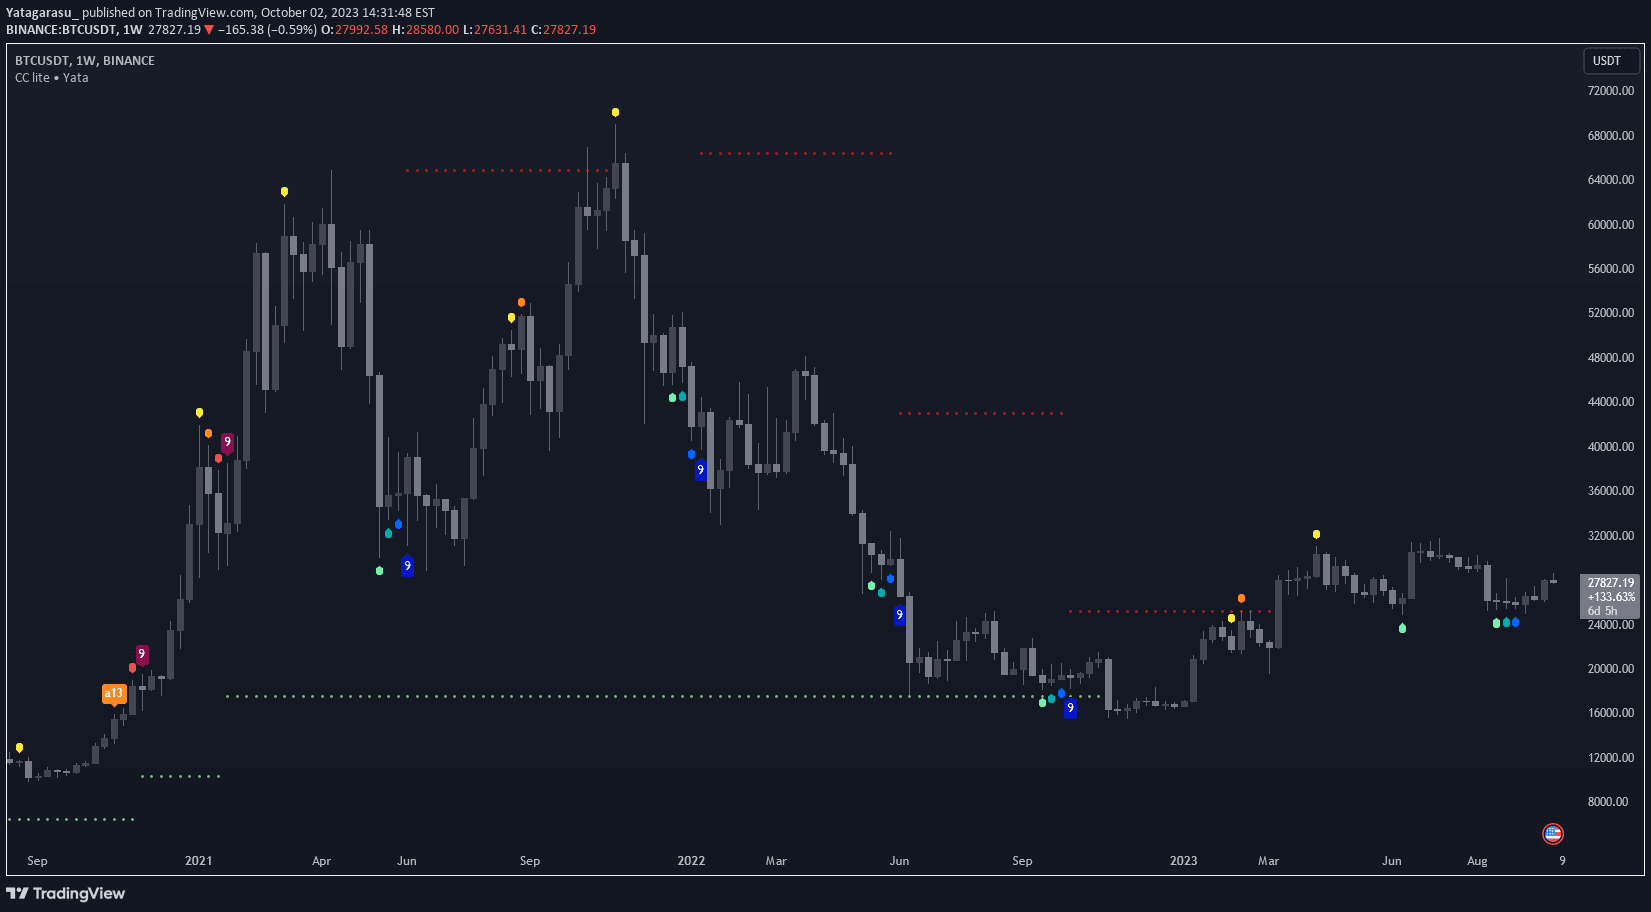
A multi-timeframe EMA indicator that automatically identifies and plots the closest upper and lower Exponential Moving Average levels across different timeframes for trend analysis.
Explore complementary indicator rolesHow it works
The EMA Levels Indicator operates by calculating Exponential Moving Averages across multiple timeframes, ranging from 1-minute to 1-week charts. For shorter timeframes like 1-minute and 5-minute, it focuses on the 200 EMA, while other timeframes incorporate 20, 50, 100, and 200 EMAs to provide a comprehensive view of price dynamics.
The indicator automatically detects and highlights the nearest EMA levels above and below the current price, creating a visual representation of potential support and resistance zones. Traders can customize the display settings, including line style, thickness, and colors, to suit their analytical preferences and make the indicator more intuitive and informative.
Why it may be useful
Multi-timeframe EMA levels provide traders with a robust framework for understanding market trends and potential price reversals across different trading perspectives. By offering a comprehensive view of price movement, the indicator helps traders identify key support and resistance zones that might not be apparent on a single timeframe.
The ability to visualize EMA levels across multiple timeframes enhances traders' decision-making process by providing context and depth to technical analysis. This approach allows traders to align their strategies with broader market trends while also identifying potential entry and exit points with greater precision.
When to explore it
The EMA Levels Indicator is most effective during trending market conditions where price consistently respects moving average levels as support or resistance. Traders can leverage this tool during both bullish and bearish market environments to gain insights into potential price movements and trend strength.
This indicator is particularly useful for traders seeking to develop a multi-timeframe analysis strategy, offering valuable insights for scalping, day trading, and swing trading approaches. By providing clear visual cues and customizable settings, the EMA Levels Indicator helps traders make more informed decisions across various market conditions and trading styles.
Keep exploring
What we’ve verified
Access, alerts and repainting behaviour have not been independently verified for this indicator. Check the creator’s current publication and settings.
General descriptions and classifications are recovered research. Verified details above identify the specific checks we have completed. Check the creator’s current publication for later changes.