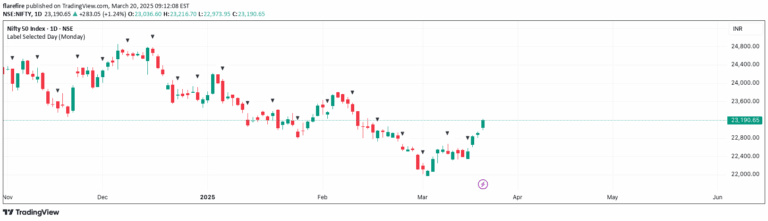
A trading indicator that automatically identifies the first bar of each trading day, helping traders visually mark daily session boundaries across different market types.
Explore complementary indicator rolesHow it works
The New Day indicator operates by automatically detecting and marking the first trading bar of each day on a chart. For traditional stock and futures markets, it identifies the initial bar of the standard trading session. In 24-hour markets like cryptocurrency and forex, the indicator pinpoints the bar closest to midnight as the day's first trading bar.
Once identified, the indicator creates a visual line demarcating the start of the new trading day. Users can customize this line's appearance by adjusting its color, width, and style to suit their visual preferences and charting needs.
Why it may be useful
The New Day indicator provides traders with a clear visual reference point for daily market transitions, helping them quickly understand session boundaries and potential trend shifts. By automatically marking the first bar of each trading day, it reduces manual tracking and allows traders to focus more on analysis and strategy.
This tool is especially valuable for traders who need to maintain a structured view of market sessions across different asset classes. It offers a consistent method of tracking daily market movements, making it easier to identify potential entry and exit points based on daily price action.
When to explore it
The New Day indicator is most effective for traders who require a clear demarcation of daily trading sessions across various market types. It is particularly useful for stock, futures, forex, and cryptocurrency traders who want to maintain a structured view of their trading periods and potential daily trend changes.
Traders can benefit from this indicator during market analysis, strategy development, and real-time trading. It helps in identifying potential support and resistance levels, understanding daily price movements, and maintaining a systematic approach to tracking market transitions.
Keep exploring
What we’ve verified
Access, alerts and repainting behaviour have not been independently verified for this indicator. Check the creator’s current publication and settings.
General descriptions and classifications are recovered research. Verified details above identify the specific checks we have completed. Check the creator’s current publication for later changes.