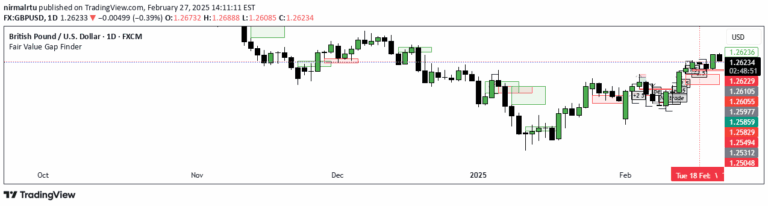
A trading strategy identifying price imbalances through three-candle patterns, revealing potential entry zones where institutional orders have created market inefficiencies.
Explore complementary indicator rolesHow it works
Fair Value Gaps (FVGs) are identified by analyzing a unique three-candle pattern where the middle candle demonstrates a strong, large body with minimal overlap from surrounding candles. These gaps represent moments of significant price movement, typically driven by institutional trading orders that create temporary market imbalances between buyers and sellers.
The formation is marked by specific boundaries: for bullish gaps, between the high of the first candle and the low of the third candle, and conversely for bearish gaps. Traders visually identify these zones as potential areas where price might retrace, seeking to 'fill' the trading inefficiency and restore market equilibrium.
Why it may be useful
Fair Value Gaps provide traders with critical insights into potential market movements by revealing areas of price inefficiency created by significant institutional order flow. These gaps help traders understand underlying market dynamics, showing where substantial buying or selling pressure has temporarily disrupted normal price progression.
By identifying these zones, traders can anticipate potential price retracements and plan strategic entry points with enhanced probability. The method offers a unique perspective on market structure, allowing traders to align their strategies with probable institutional intentions and market sentiment.
When to explore it
Fair Value Gaps are most effective when used in conjunction with other technical analysis tools like order blocks, liquidity zones, or Fibonacci levels. They work particularly well in trending markets, where price movements are more predictable and directional momentum is clear.
Traders should apply FVGs during periods of strong trend development, either in uptrends or downtrends, where the likelihood of price retracing into the identified gap is higher. The strategy is especially powerful when multiple confirming indicators suggest potential trend continuation or reversal.
Keep exploring
What we’ve verified
Access, alerts and repainting behaviour have not been independently verified for this indicator. Check the creator’s current publication and settings.
General descriptions and classifications are recovered research. Verified details above identify the specific checks we have completed. Check the creator’s current publication for later changes.