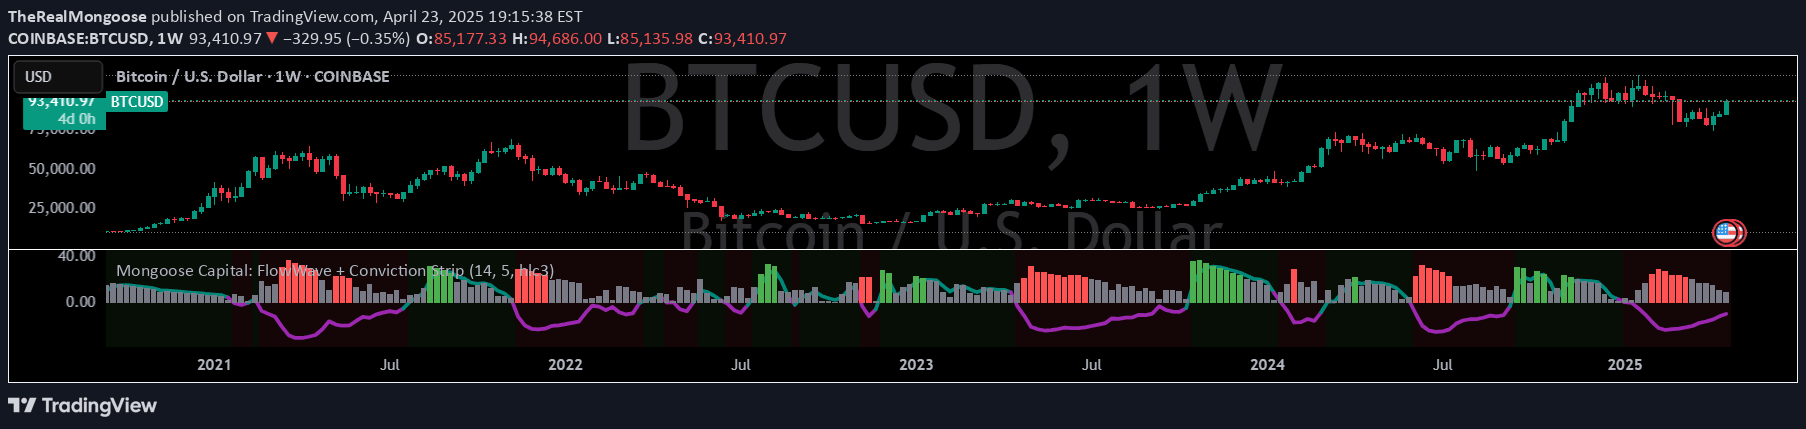
Net Unrealized Profit Loss (NUPL) measures the profit state of the Bitcoin network, indicating whether past BTC transfers are in unrealized profit or loss.
Explore complementary indicator rolesHow it works
The Net Unrealized Profit Loss (NUPL) calculates the total unrealized profit or loss across the entire Bitcoin network by comparing the current price with the price at which bitcoins were last transferred. It tracks the aggregate profit or loss state of all BTC holders by comparing their purchase prices to the current market price.
For identifying market tops and bottoms, NUPL uses predefined thresholds. Tops are signaled when the NUPL value exceeds a trigger line (default 73), which can be a dynamic decreasing linear function or a horizontal line. Bottoms are identified when the NUPL drops below a specific threshold (default -13), indicating significant network-wide unrealized losses.
Why it may be useful
NUPL provides a unique macro-level perspective on Bitcoin market sentiment by revealing the collective financial state of all BTC holders. It helps traders understand whether the network is in an overall profit or loss condition, which can indicate potential market turning points and investor psychology.
By tracking the unrealized profit and loss across the entire Bitcoin network, traders can gain insights into market cycles, potential overbought or oversold conditions, and gauge the overall market's emotional state. This indicator offers a broader, more comprehensive view of market dynamics beyond traditional price-based analysis.
When to explore it
NUPL is most effective for long-term swing trading and macro market analysis, particularly for identifying potential market tops and bottoms in the Bitcoin market. It works best during significant market transitions, helping traders recognize when the network is experiencing widespread profit or loss.
Traders should use NUPL in conjunction with other technical and fundamental indicators to confirm market signals. It is particularly useful for understanding broader market cycles, detecting potential market exhaustion points, and making strategic investment decisions in the cryptocurrency market.
Keep exploring
What we’ve verified
Access, alerts and repainting behaviour have not been independently verified for this indicator. Check the creator’s current publication and settings.
General descriptions and classifications are recovered research. Verified details above identify the specific checks we have completed. Check the creator’s current publication for later changes.