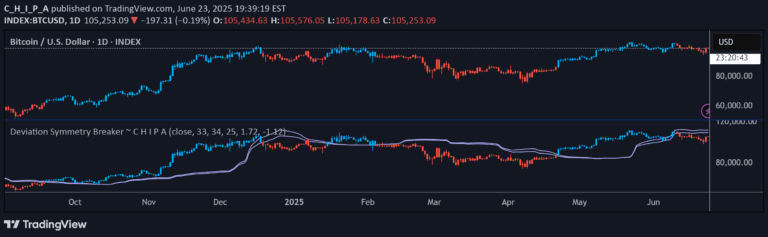
A trading strategy combining the New Week Opening Gap and Fair Value Gap to identify high-probability trade setups by analyzing price action and market imbalances.
Explore complementary indicator rolesHow it works
The New Week Opening Gap (NWOG) identifies key price levels by marking the high and low of the first candle in a new trading week. Traders use these levels as reference points to assess market sentiment and potential support or resistance zones. The indicator tracks whether price is trading above, below, or touching these initial week levels.
Simultaneously, the Fair Value Gap (FVG) detects price imbalances between consecutive candlesticks where a gap exists. These gaps represent areas where the market moved quickly, leaving behind an untraded price region. Traders look for price to potentially retrace and fill these gaps, using them as potential entry or exit points for trades.
Why it may be useful
The NWOG and FVG combined indicator provides traders with a comprehensive approach to understanding market dynamics by integrating weekly context and price action inefficiencies. By identifying significant price levels and market imbalances, traders can make more informed decisions about potential trade entries and exits. This approach helps reduce emotional trading and provides a structured method for analyzing market movements.
The indicator offers multiple layers of confirmation by combining two distinct analytical concepts. It helps traders recognize potential support and resistance zones, understand market sentiment, and identify high-probability trading opportunities. This multi-dimensional approach increases the trader's ability to make strategic decisions based on objective market analysis.
When to explore it
The NWOG and FVG indicator works best in markets with clear trending behavior and sufficient price volatility. It is particularly effective in liquid markets like forex, stocks, and futures, where price movements are more predictable and gaps are more likely to occur. Traders should use this indicator in timeframes that allow enough price action to develop, typically daily or higher resolution charts.
The strategy is most powerful during periods of market transition, such as the beginning of a new trading week or during significant economic events. Traders should combine this indicator with other technical analysis tools and confirm signals with additional indicators or price action patterns to improve overall trading accuracy and risk management.
Keep exploring
What we’ve verified
Access, alerts and repainting behaviour have not been independently verified for this indicator. Check the creator’s current publication and settings.
General descriptions and classifications are recovered research. Verified details above identify the specific checks we have completed. Check the creator’s current publication for later changes.