
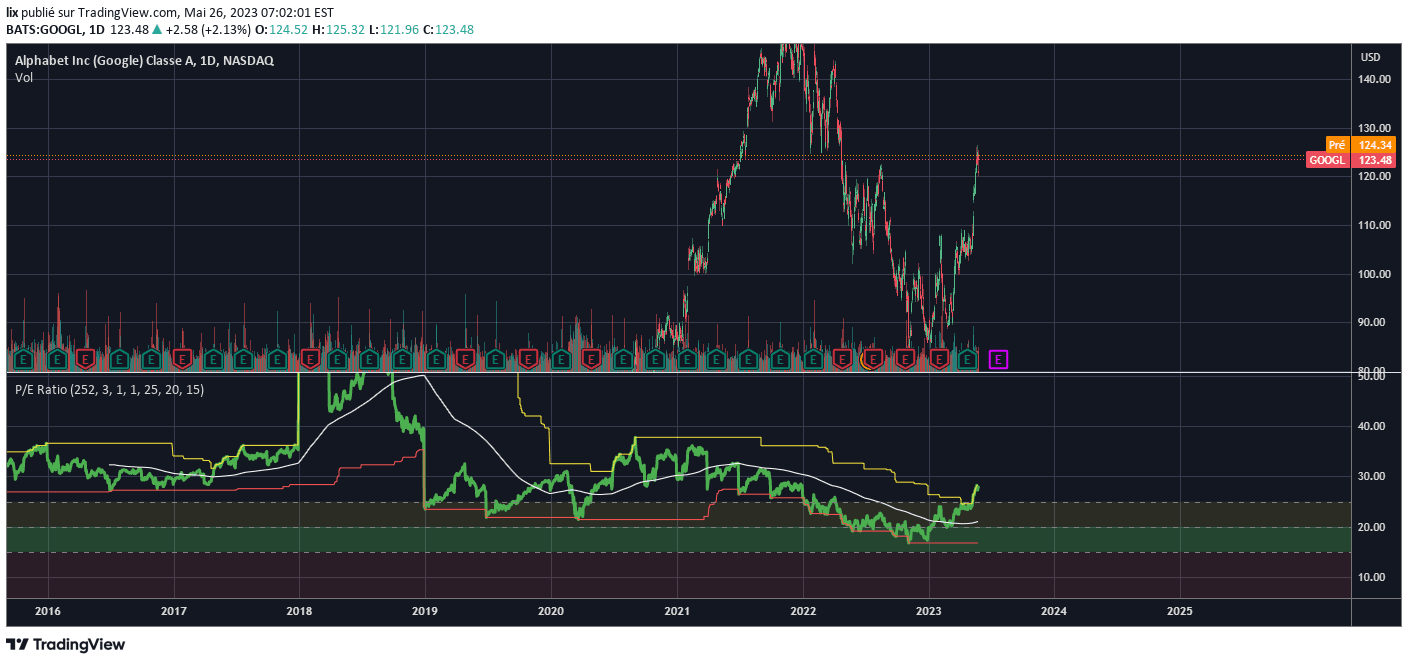
The P/E Ratio indicator plots price-to-earnings range with highest, lowest, and average values, highlighting key valuation zones for stock analysis.
Explore complementary indicator rolesHow it works
The P/E Ratio indicator calculates the relationship between a stock's market price and its earnings per share, presenting a comprehensive view of valuation. It plots multiple key metrics including the highest, lowest, and average P/E values across different historical periods.
The indicator also highlights two specific ranges: 25-20 and 20-0, which are considered standard P/E evaluation zones. These ranges help traders understand whether a stock is potentially overvalued, undervalued, or trading within typical market expectations.
Why it may be useful
The P/E Ratio is crucial for understanding a stock's relative valuation and market sentiment, providing investors with insights into how the market prices a company's earnings. It helps traders assess whether a stock is trading at a premium or discount compared to its historical performance and sector benchmarks.
By presenting multiple reference points like highest, lowest, and average values, the indicator offers a nuanced view of a stock's valuation trajectory. This comprehensive perspective enables more informed investment decisions based on fundamental financial analysis.
When to explore it
The P/E Ratio indicator is most effective during fundamental analysis and when evaluating long-term investment opportunities in stable market conditions. It works best for stocks with consistent earnings history and in sectors with predictable financial performance.
Traders should use this indicator when comparing stocks within the same industry, assessing potential value investments, or determining whether a stock is potentially overvalued or undervalued. It's particularly useful for swing traders and investors looking to make strategic, data-driven investment choices.
Keep exploring
What we’ve verified
Access, alerts and repainting behaviour have not been independently verified for this indicator. Check the creator’s current publication and settings.
General descriptions and classifications are recovered research. Verified details above identify the specific checks we have completed. Check the creator’s current publication for later changes.


