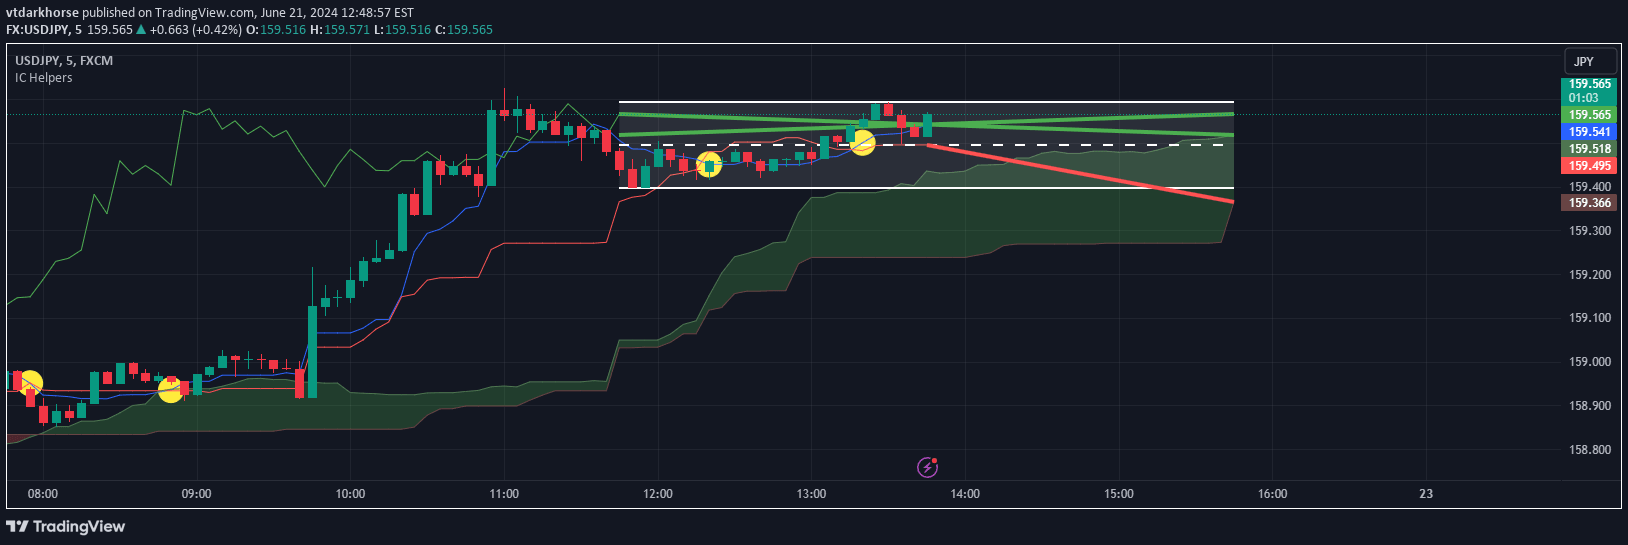
A trading script that identifies and marks the first and second high/low points across multiple timeframes, providing a structured approach to tracking price extremes.
Explore complementary indicator rolesHow it works
The script dynamically tracks and identifies the first and second price extremes (high and low points) across different timeframes, creating a P1/P2 format. P1 represents the first point reached, whether it's the highest or lowest price, while P2 represents the subsequent point.
By mapping these points chronologically, the script provides a systematic method for understanding price movement sequence and identifying potential support levels. This approach allows traders to visualize the order of price extremes and gain insights into the market's short-term structural dynamics.
Why it may be useful
Understanding the sequence of price extremes helps traders identify potential support and resistance levels more accurately. By tracking which point (high or low) occurred first, traders can develop a more nuanced view of market structure and potential trend reversals.
This methodology provides a granular approach to price analysis, enabling traders to make more informed decisions about entry and exit points. The P1/P2 format offers a unique perspective on market dynamics that goes beyond traditional support and resistance analysis.
When to explore it
This signal is most effective in volatile markets with clear price swings and distinct high and low points. It works particularly well for traders who want to understand the chronological sequence of price movements across multiple timeframes.
Traders can utilize this approach during periods of market uncertainty, when traditional support and resistance levels might not provide a complete picture of price action. It is especially useful for short to medium-term trading strategies that require a detailed understanding of price movement sequence.
Keep exploring
What we’ve verified
Access, alerts and repainting behaviour have not been independently verified for this indicator. Check the creator’s current publication and settings.
General descriptions and classifications are recovered research. Verified details above identify the specific checks we have completed. Check the creator’s current publication for later changes.