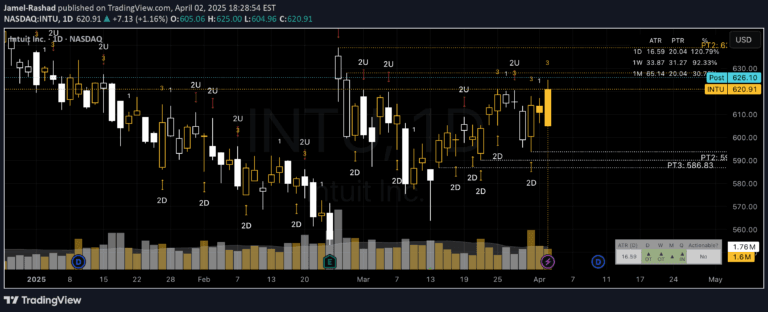
A candlestick pattern recognition tool that identifies specific bullish and bearish formations on current day's high and low price ranges to signal potential trend reversals.
Explore complementary indicator rolesHow it works
The indicator searches for specific candlestick patterns on the current trading day's price range, focusing on high and low points. It identifies key formations like Bullish/Bearish Engulfing, Harami patterns, and Hammer/Inverted Hammer candlesticks that suggest potential trend changes.
For bullish signals, the tool looks for patterns indicating potential upward price movement, while for bearish signals, it seeks patterns suggesting potential downward price direction. Users can customize the indicator by enabling or disabling specific candlestick pattern searches.
Why it may be useful
Candlestick pattern recognition provides traders with visual insights into potential market sentiment and trend reversals. These patterns help identify moments when buying or selling pressure might be shifting, offering early warning signals for possible price movements.
By understanding these subtle price action signals, traders can make more informed decisions about entry and exit points. The indicator transforms complex price movements into easily recognizable patterns, helping traders interpret market psychology and potential trend changes.
When to explore it
This candlestick pattern indicator works best in markets with clear, distinct price movements and during periods of potential trend reversals. It is particularly effective in more volatile markets where price action shows clear momentum shifts and defined trading ranges.
Traders should use this tool in conjunction with other technical analysis methods, as candlestick patterns are most reliable when confirmed by additional indicators or market context. It is especially useful for day traders and scalpers who need quick, visual signals about potential short-term price movements.
Keep exploring
What we’ve verified
Access, alerts and repainting behaviour have not been independently verified for this indicator. Check the creator’s current publication and settings.
General descriptions and classifications are recovered research. Verified details above identify the specific checks we have completed. Check the creator’s current publication for later changes.