
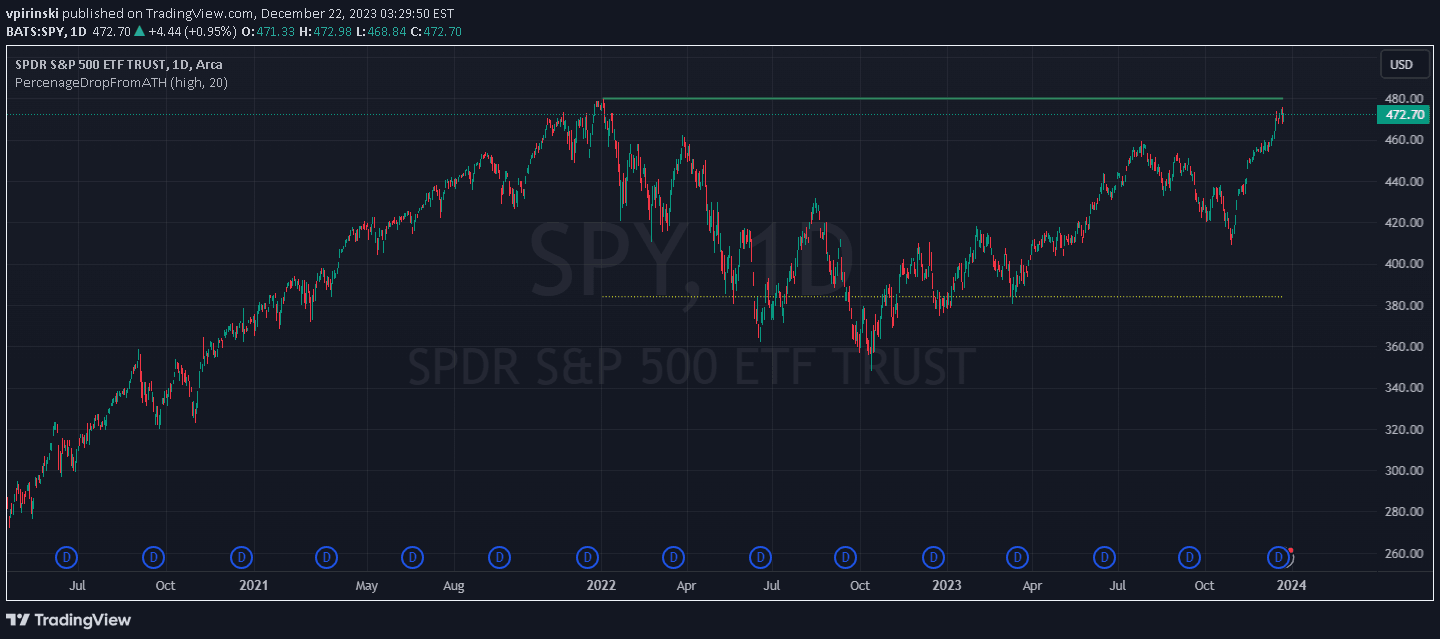
A technical indicator that tracks an asset's all-time high (ATH) and alerts traders when the price drops by a specified percentage, helping identify potential entry points.
Explore complementary indicator rolesHow it works
The Percentage Drop from ATH script identifies the highest price point in an asset's entire historical chart, marking this as the all-time high (ATH). Users can configure a specific percentage drop from this peak, which triggers an alert or visual indication when the price reaches that level.
The indicator allows customization of the ATH source, enabling traders to calculate the peak using different price data points like high, open, close, or low. When the price drops to the predefined percentage below the ATH, the script highlights this level, providing a clear visual reference for potential investment opportunities.
Why it may be useful
This indicator is crucial for investors seeking disciplined, systematic approach to entering markets during price corrections. By providing a structured method to track significant price drops from historical peaks, traders can make more informed decisions about when to accumulate positions or initiate investments.
The tool is particularly valuable for passive investors in indices and ETFs, offering a methodical way to identify potential buying opportunities. It helps remove emotional decision-making by providing objective, pre-determined entry points based on percentage drops from all-time highs.
When to explore it
The Percentage Drop from ATH is most effective for long-term investors and swing traders focusing on broad market indices, ETFs, and assets with relatively stable long-term trends. It works best when applied to markets with consistent historical performance, such as major stock indices, sector ETFs, and commodities.
Traders should use this indicator during market corrections or prolonged downtrends, where systematic buying at predetermined levels can help average down investment costs. It is particularly useful for implementing dollar-cost averaging (DCA) strategies, allowing investors to build positions gradually as prices decline from their historical peaks.
Keep exploring
What we’ve verified
Access, alerts and repainting behaviour have not been independently verified for this indicator. Check the creator’s current publication and settings.
General descriptions and classifications are recovered research. Verified details above identify the specific checks we have completed. Check the creator’s current publication for later changes.


