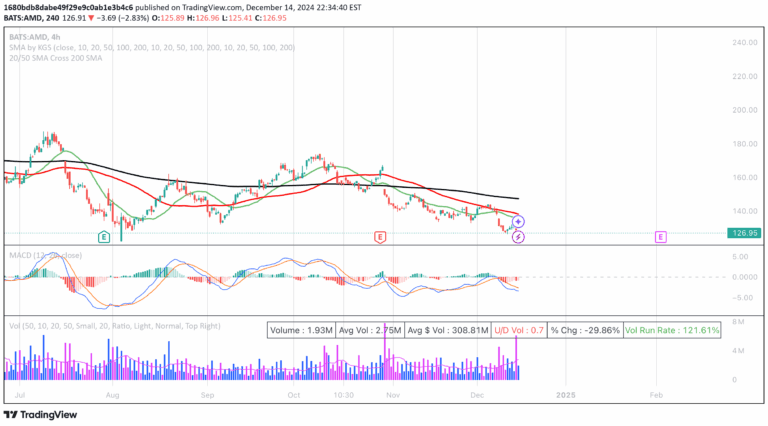
A dynamic indicator that identifies the most influential moving average across multiple timeframes, revealing the strongest trend and potential market support or resistance levels.
Explore complementary indicator rolesHow it works
The Power Core MA indicator analyzes moving averages ranging from 50 to 400 periods to determine the most significant trend-defining average. By comparing multiple moving average lengths, it identifies the 'Current Core MA' - a blue line representing the moving average most closely aligned with surrounding averages. This process involves complex computational analysis that dynamically tracks price movements and smoothing techniques.
The indicator generates a table displaying two critical values: the 'Current Core MA' length and the 'Historical Core MA' average length. These metrics help traders understand which moving average is currently most influential and how moving average significance has evolved over time, providing a comprehensive view of trend dynamics.
Why it may be useful
The Power Core MA simplifies the complex process of moving average analysis by automatically identifying the most relevant trend indicator. Instead of manually testing multiple moving average lengths, traders can rely on this tool to quickly determine the most significant trend-defining average. This saves considerable time and reduces the potential for subjective interpretation, offering a data-driven approach to trend analysis.
By combining current and historical moving average data, the indicator provides traders with a nuanced understanding of market behavior. It helps identify potential support and resistance levels, trend directions, and optimal entry or exit points, making it a valuable tool for traders seeking to make more informed and strategic trading decisions.
When to explore it
The Power Core MA is most effective in markets with clear, established trends where multiple moving averages can be compared. It works best in financial instruments with sufficient historical price data, allowing for robust computational analysis. Traders should use this indicator when they want to cut through market noise and focus on the most significant trend-defining moving average.
This indicator is particularly useful during periods of market transition, where trend strength and direction are uncertain. By providing insights into both current and historical moving average performance, it helps traders adapt their strategies to changing market conditions and identify potential trend reversals or continuations.
Keep exploring
What we’ve verified
Access, alerts and repainting behaviour have not been independently verified for this indicator. Check the creator’s current publication and settings.
General descriptions and classifications are recovered research. Verified details above identify the specific checks we have completed. Check the creator’s current publication for later changes.