
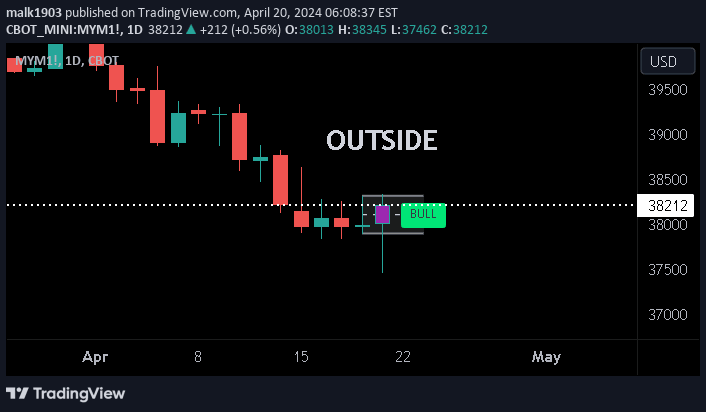
A trading indicator that analyzes the relationship between current and previous price candles, providing insights into potential market direction and momentum through price action analysis.
Explore complementary indicator rolesHow it works
The signal operates by comparing the current price candle with the previous candle's high, low, and midpoint to generate actionable trading insights. It identifies specific price action conditions such as inside bars, potential outside bars, and breaks of previous candle's high or low levels.
The indicator tracks key price movements, including whether the current candle is contained within the previous candle's range or potentially breaking out. It also assesses the current price position relative to the previous candle's midpoint, providing visual labels and markers to highlight potential bullish or bearish conditions.
Why it may be useful
This signal helps traders understand subtle price action dynamics that might indicate potential trend changes or momentum shifts. By providing visual cues about the relationship between consecutive candles, traders can gain insights into market psychology and potential directional movements.
The indicator offers a systematic approach to analyzing price action, reducing emotional decision-making and providing objective markers for potential trading opportunities. It helps traders identify potential trend reversals, breakouts, and market sentiment through a structured visual analysis of price candle interactions.
When to explore it
The indicator is most effective when used on higher timeframes like daily, weekly, and monthly charts for comprehensive market assessment. It provides valuable insights during periods of potential trend transitions or when markets are showing signs of consolidation or potential breakout.
Traders should use this signal in conjunction with other technical analysis tools and during periods of clear market structure. It is particularly useful for identifying potential trend changes, assessing market momentum, and providing additional context to existing trading strategies.
Keep exploring
What we’ve verified
Access, alerts and repainting behaviour have not been independently verified for this indicator. Check the creator’s current publication and settings.
General descriptions and classifications are recovered research. Verified details above identify the specific checks we have completed. Check the creator’s current publication for later changes.


