
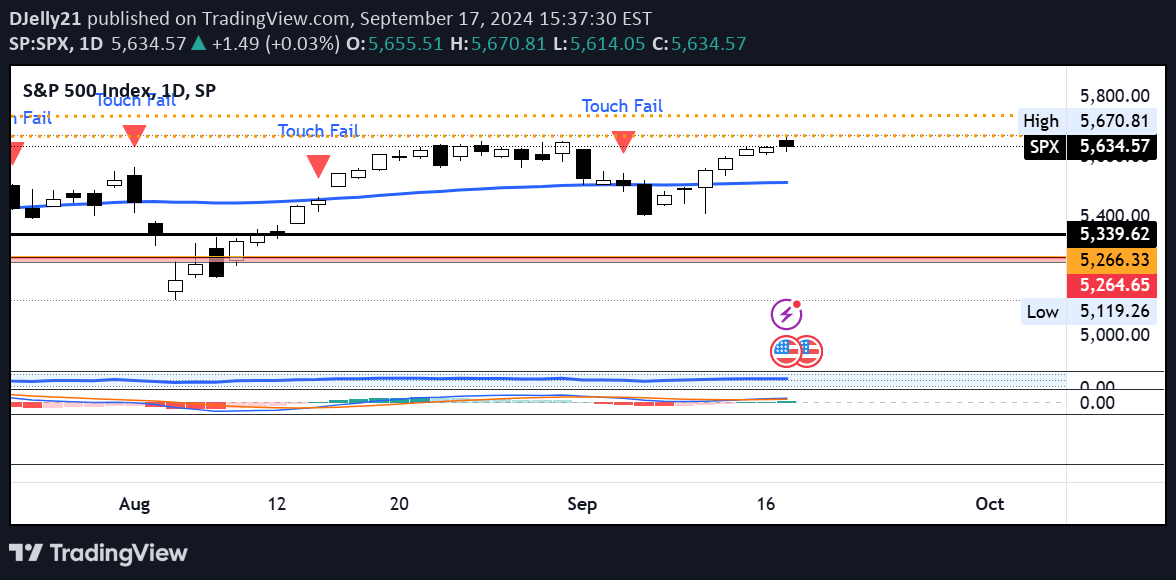
A TradingView indicator tracking price interactions with the 50-day Simple Moving Average, identifying potential support/resistance zones and price reversal opportunities.
Explore complementary indicator rolesHow it works
The indicator calculates the 50-day Simple Moving Average using closing prices, creating a dynamic trend reference line on the chart. It monitors price proximity to this moving average, detecting moments when the closing price comes within a specified tolerance percentage of the MA.
When a touch is detected, the indicator then checks whether the price fails to cross the moving average in the subsequent bar. If the price remains on the same side of the MA, it confirms a touch-and-fail event, which is visually represented by a red downward triangle plotted above the corresponding price bar.
Why it may be useful
The Price Touches 50-Day MA indicator provides traders with a sophisticated tool for understanding price dynamics and potential trend reversals. By highlighting precise interactions between price and the moving average, it offers insights into market sentiment and potential support or resistance levels.
This signal helps traders identify critical moments where price attempts to break through a key trend line but fails, suggesting potential trend continuation or reversal. The visual markers and customizable settings make it easier for traders to spot and interpret these significant market movements quickly and efficiently.
When to explore it
The indicator is most effective in markets with established trending behavior, where the 50-day moving average serves as a reliable dynamic support or resistance level. It works particularly well in stocks, forex, commodities, and cryptocurrencies that demonstrate clear mid-term trend characteristics.
Traders should consider using this signal during periods of market consolidation or when seeking to confirm potential trend reversals. It is especially valuable when combined with other technical analysis tools, providing an additional layer of confirmation for trading decisions across different timeframes and market conditions.
Keep exploring
What we’ve verified
Access, alerts and repainting behaviour have not been independently verified for this indicator. Check the creator’s current publication and settings.
General descriptions and classifications are recovered research. Verified details above identify the specific checks we have completed. Check the creator’s current publication for later changes.


