
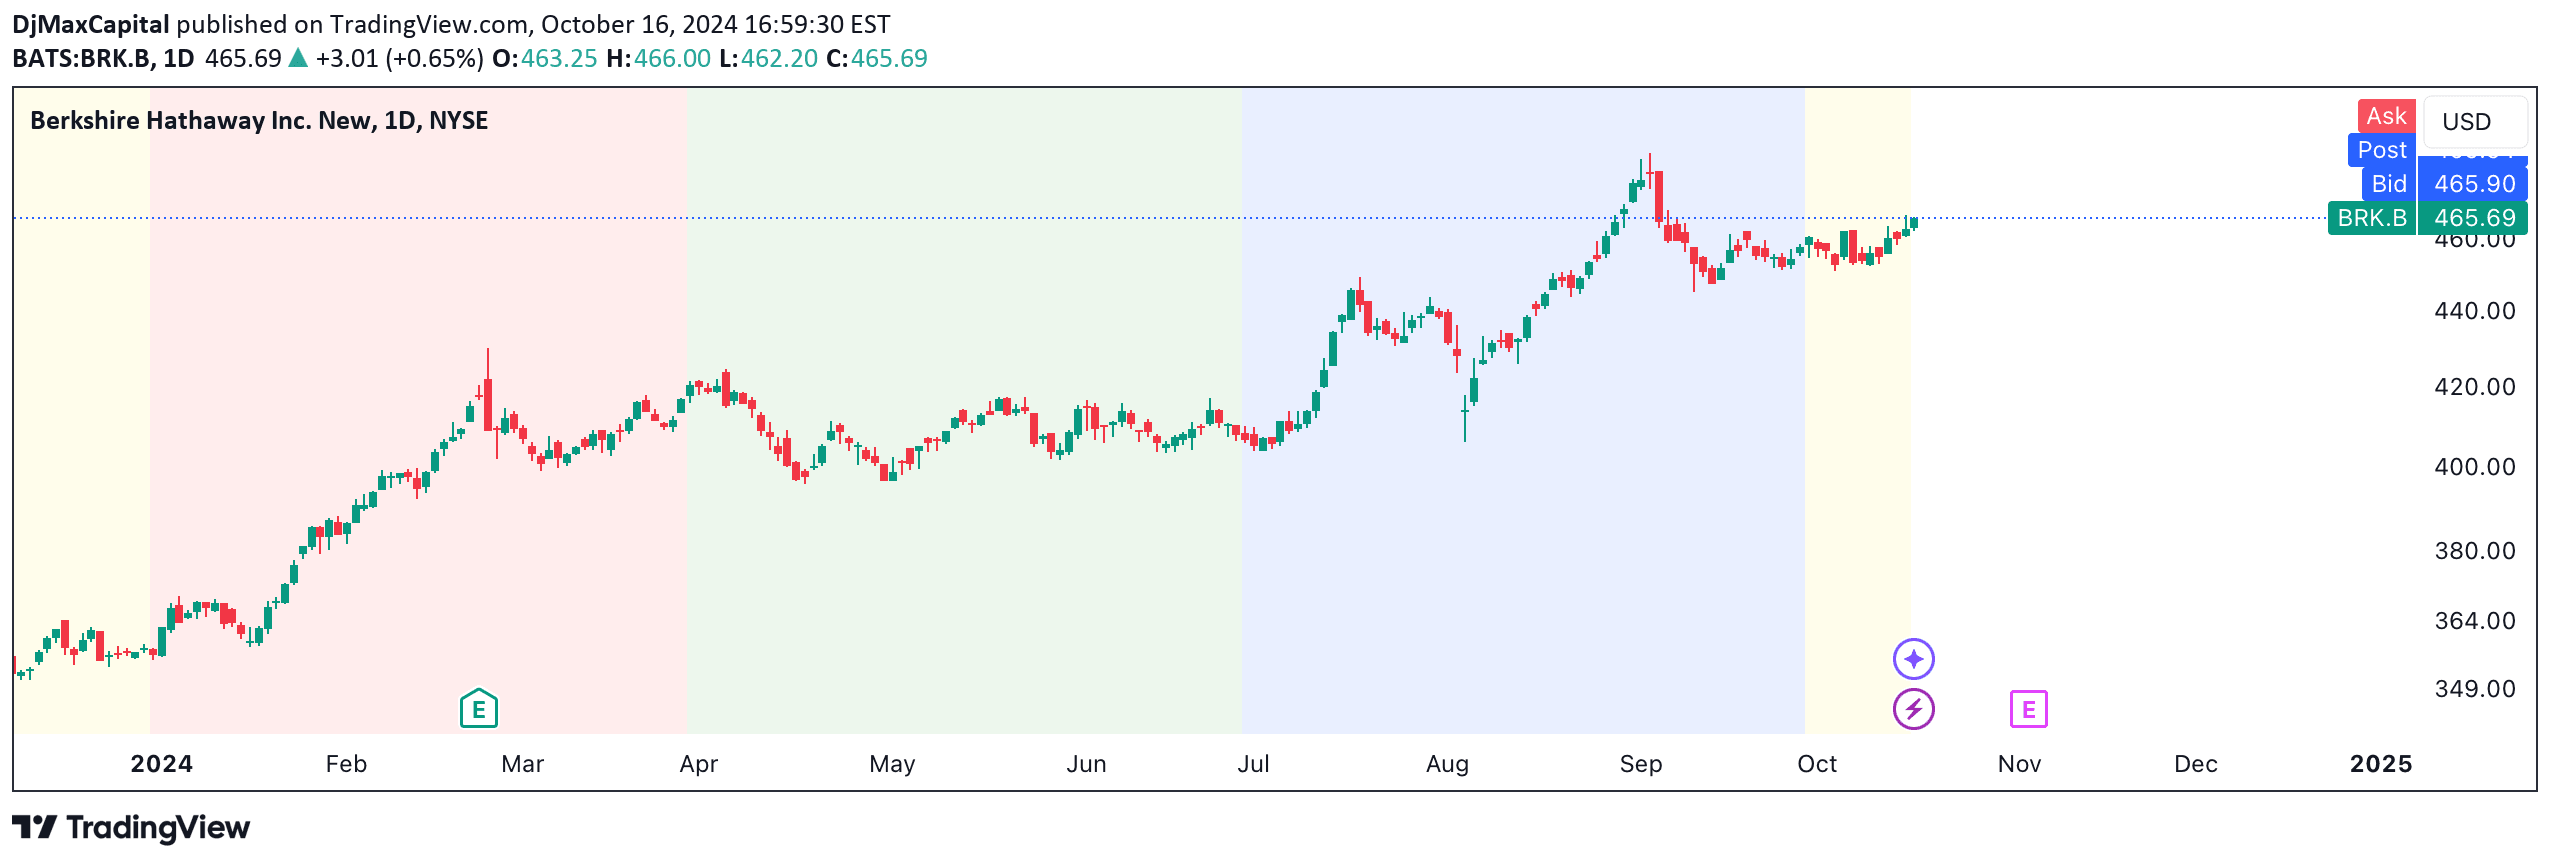
A TradingView script designed to highlight quarterly company performance, offering comprehensive market insights through visual color-coded quarterly trend analysis.
Explore complementary indicator rolesHow it works
This quarterly performance script operates by tracking and visualizing each company's financial performance across four distinct quarters using unique color representations. By mapping out quarterly data points, the script creates a comprehensive visual narrative of a company's economic trajectory and performance trends.
The script systematically color-codes each quarter, allowing traders to quickly identify performance variations and comparative insights. Through this color-based visualization, users can rapidly assess quarterly progression, highlight potential strengths or weaknesses, and understand the broader market contextual developments.
Why it may be useful
This signal provides traders with a sophisticated method of understanding company performance beyond traditional numeric analysis. By transforming quarterly data into visually intuitive color-coded representations, it enables faster comprehension of complex financial information and trends.
The script's visual approach allows traders to quickly identify performance patterns, recognize potential investment opportunities, and make more informed strategic decisions. Its comprehensive view helps bridge the gap between raw financial data and actionable market insights.
When to explore it
This quarterly performance script is most effective when analyzing companies with consistent reporting histories and stable market positions. It proves particularly valuable during earnings seasons, when comparative quarterly performance becomes crucial for investment decisions.
Traders should utilize this tool when seeking broader market trend insights, wanting to compare performance across different companies, or looking to understand long-term economic trajectories. It is especially useful for swing traders and investors focused on fundamental analysis and multi-quarter performance trends.
Keep exploring
What we’ve verified
Access, alerts and repainting behaviour have not been independently verified for this indicator. Check the creator’s current publication and settings.
General descriptions and classifications are recovered research. Verified details above identify the specific checks we have completed. Check the creator’s current publication for later changes.


