
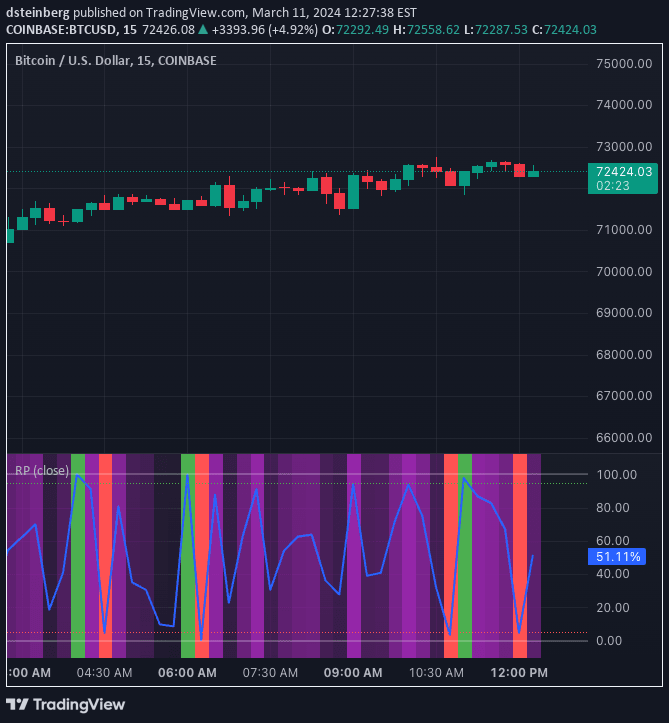
Range Percentage is a dynamic indicator that helps traders visualize where a price or series falls between upper and lower bounds, providing context for market positioning.
Explore complementary indicator rolesHow it works
The Range Percentage indicator calculates the position of a chosen series between predefined upper and lower bounds, either as series or fixed values. Traders can select specific series or constant values to define these boundaries, creating a flexible tool for comparative analysis.
The indicator then computes a percentage representing where the current value sits within the defined range. This percentage can be visually displayed, with optional threshold configurations for alerts and color-coding to provide immediate visual insights into the series' relative position.
Why it may be useful
Range Percentage offers traders a quick, intuitive way to understand market context by revealing how a price or series is positioned relative to key reference points. It transforms abstract numerical data into an easily digestible visual representation, allowing traders to rapidly assess market conditions without complex calculations.
By providing dynamic perspective, this indicator helps traders make more informed decisions about market trends, potential reversals, and comparative performance across different assets or timeframes.
When to explore it
The Range Percentage indicator is most effective when traders want to quickly understand the relative positioning of a price or series within a meaningful context. It works particularly well when comparing price movements against support/resistance levels, tracking asset performance, or monitoring trend progression.
Traders can leverage this tool across various market conditions, from identifying trend strength to analyzing relative performance between different securities. It's especially useful when zooming into specific chart ranges or when needing a quick visual representation of market positioning.
Keep exploring
What we’ve verified
Access, alerts and repainting behaviour have not been independently verified for this indicator. Check the creator’s current publication and settings.
General descriptions and classifications are recovered research. Verified details above identify the specific checks we have completed. Check the creator’s current publication for later changes.


