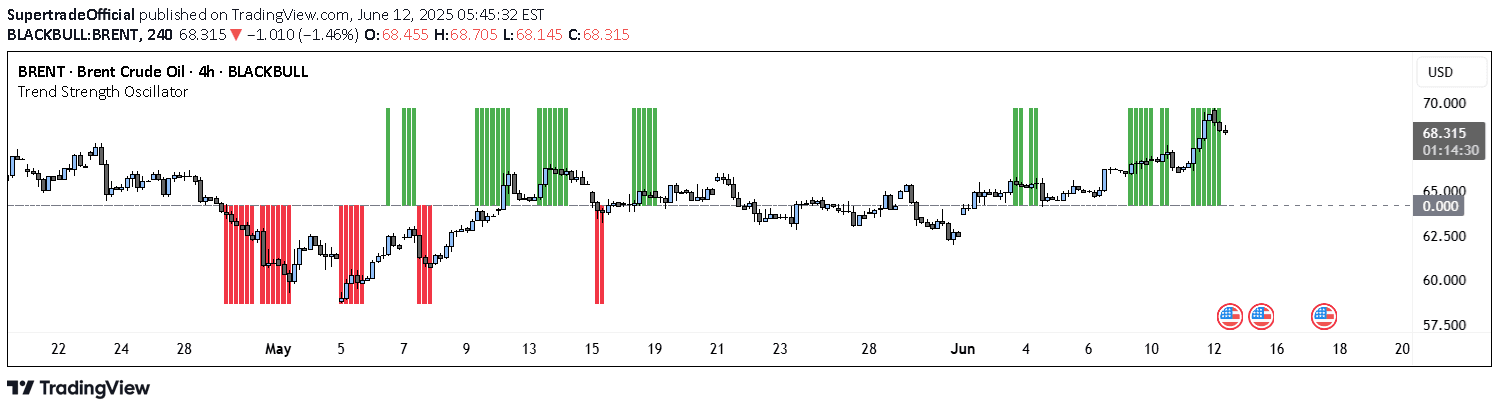
The Rate of Deviation indicator measures the current price's variance from its average price over a specified length, revealing potential price deviations and market dynamics.
Explore complementary indicator rolesHow it works
The Rate of Deviation indicator calculates price variation by comparing the current price to its average price over a specified number of bars. It determines the degree of deviation above or below a base level, helping traders understand the current price's relationship to its historical average.
By tracking these variations, the indicator generates a visual representation of price movement intensity. When the deviation exceeds the base level, it suggests the current price is significantly different from the average, potentially signaling a potential trend change or market momentum shift.
Why it may be useful
The Rate of Deviation indicator provides traders with a quick and intuitive method to assess price momentum and potential market trends. By highlighting price variations from the average, it helps identify periods of price compression or expansion, which can signal potential trading opportunities.
Understanding these deviations allows traders to make more informed decisions about market entry and exit points. The indicator can help confirm trend strength, detect potential reversals, and provide insights into market volatility and price behavior.
When to explore it
The Rate of Deviation indicator is most effective in markets with clear trending characteristics and moderate volatility. It works best when used in conjunction with other technical analysis tools to confirm signals and validate potential trading strategies.
Traders should apply this indicator during periods of consistent price movement, such as during strong bullish or bearish trends. It is particularly useful for short-term trading styles like scalping and day trading, where quick identification of price variations can lead to timely trading decisions.
Keep exploring
What we’ve verified
Access, alerts and repainting behaviour have not been independently verified for this indicator. Check the creator’s current publication and settings.
General descriptions and classifications are recovered research. Verified details above identify the specific checks we have completed. Check the creator’s current publication for later changes.