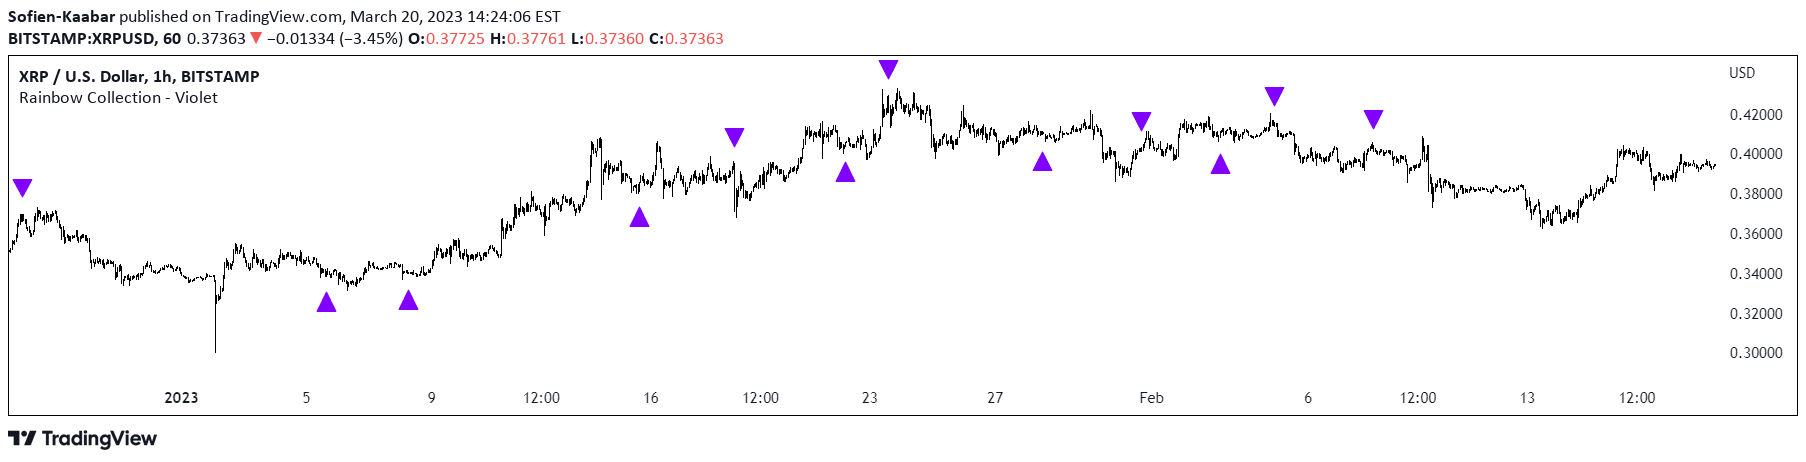
A simplified risk metric for Bitcoin that combines three different approaches to analyze price movement and trend dynamics using moving averages and logarithmic calculations.
Explore complementary indicator rolesHow it works
The risk metric utilizes three distinct analytical methods to assess Bitcoin's price dynamics. First, it calculates the deviation from a 4-year simple moving average, which provides a long-term perspective on price trends and potential market cycles.
The second approach involves calculating the natural logarithm of Bitcoin's price relative to a 20-week weighted moving average. The third method compares the 50-day moving average to the 50-week moving average, creating a comprehensive view of short-term and long-term price momentum.
Why it may be useful
This multi-faceted risk metric offers traders a nuanced understanding of Bitcoin's price behavior by integrating different analytical perspectives. By combining multiple approaches, the indicator provides a more robust assessment of potential market trends and risk levels.
Traders can use this metric to gain insights into Bitcoin's price movements across different timeframes, helping them make more informed trading decisions. The comprehensive approach reduces the likelihood of false signals by cross-referencing multiple analytical methods.
When to explore it
The risk metric is most effective during periods of significant market volatility and when traders want a comprehensive view of Bitcoin's price trends. It works particularly well when analyzing longer-term market cycles and identifying potential trend reversals.
Traders should apply this metric when seeking a holistic approach to market analysis, especially when making strategic decisions about entry and exit points. It is particularly useful for traders interested in understanding both short-term momentum and long-term price trends in the Bitcoin market.
Keep exploring
What we’ve verified
Access, alerts and repainting behaviour have not been independently verified for this indicator. Check the creator’s current publication and settings.
General descriptions and classifications are recovered research. Verified details above identify the specific checks we have completed. Check the creator’s current publication for later changes.