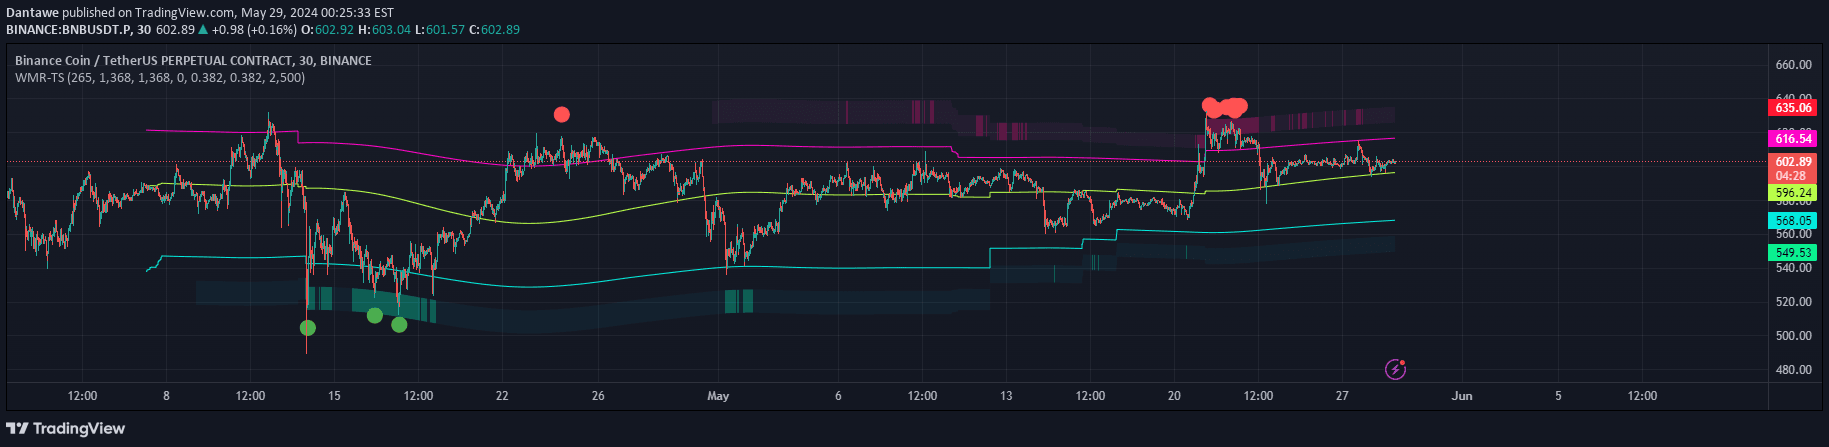
A customizable price level indicator designed for quick morning trading visualization, allowing traders to plot and track multiple key price levels and trading zones.
Explore complementary indicator rolesHow it works
The Savage Morning indicator allows traders to manually input and visualize multiple critical price levels on their trading chart. Users can define specific price points such as resistance, support, gap prices, and key levels, giving them a flexible tool for technical analysis.
Each price level can be individually toggled for visibility, enabling traders to customize their chart view based on their specific trading strategy. The indicator plots these levels as distinct lines with unique colors, making it easy to quickly identify and track important price zones during market analysis.
Why it may be useful
By providing a visual representation of key price levels, this indicator helps traders quickly identify potential entry and exit points in the market. It transforms complex price data into a more intuitive and immediately understandable format, allowing traders to make faster and more informed decisions.
The customizable nature of the indicator means traders can adapt it to their individual trading style, whether they're focusing on specific support and resistance levels or tracking multiple price zones simultaneously. This flexibility makes the tool valuable for traders across different markets and trading approaches.
When to explore it
The Savage Morning indicator is most effective during volatile market conditions where multiple price levels need quick identification and tracking. It's particularly useful in morning trading sessions when rapid price movements can create opportunities for quick decision-making.
Traders can leverage this tool in markets with clear trending or range-bound characteristics, where identifying key support and resistance levels becomes crucial for strategic entry and exit points. It's especially beneficial for day traders and scalpers who require immediate visual cues about potential price interactions.
Keep exploring
What we’ve verified
Access, alerts and repainting behaviour have not been independently verified for this indicator. Check the creator’s current publication and settings.
General descriptions and classifications are recovered research. Verified details above identify the specific checks we have completed. Check the creator’s current publication for later changes.