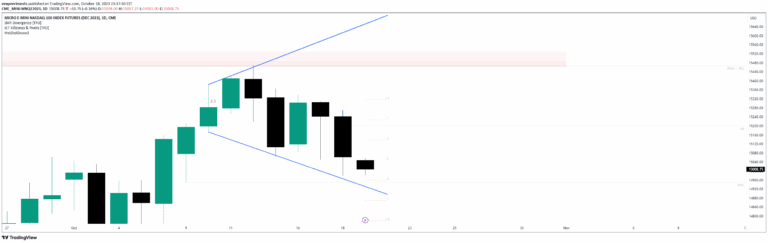
A scaled ATR range indicator that analyzes historical price data, adjusting for inflation and market conditions to provide insights into potential price ranges and market behavior.
Explore complementary indicator rolesHow it works
The Scaled ATR Range indicator allows traders to select a specific historical time period and analyze its price behavior by scaling returns and converting the range to a corrected version based on current market conditions. It uses historical data to calculate the Average True Range (ATR), adjusting for inflation and natural ticker growth by multiplying historic returns against the current period's open price.
The indicator provides flexibility through filtering options, enabling users to analyze data across all periods, or specifically focus on bullish or bearish market conditions. By transforming historical data into a contextually relevant format, it helps traders understand potential price ranges and market trajectories relative to past performance.
Why it may be useful
This indicator bridges the gap between historical market data and current market conditions, providing traders with a sophisticated tool for understanding potential price movements and market behavior. By scaling and adjusting historical data, it offers a more nuanced view of market trends that goes beyond simple static analysis.
The tool is particularly valuable for analysts seeking to understand how current market conditions compare to historical periods, offering insights into potential upside, downside, and anticipated price ranges. It transforms complex statistical analysis into an accessible format, making advanced market research more approachable for both professional and recreational traders.
When to explore it
The Scaled ATR Range indicator is most effective when traders want to perform detailed historical market analysis and compare current market conditions to past performance. It is particularly useful during periods of market uncertainty or when attempting to establish potential price targets based on historical data.
Traders can leverage this tool when examining long-term market trends, comparing current year performance against similar historical periods, and seeking to understand potential price ranges across different market conditions. It is especially valuable for swing traders and investors who want a comprehensive view of market behavior beyond short-term price movements.
Keep exploring
What we’ve verified
Access, alerts and repainting behaviour have not been independently verified for this indicator. Check the creator’s current publication and settings.
General descriptions and classifications are recovered research. Verified details above identify the specific checks we have completed. Check the creator’s current publication for later changes.