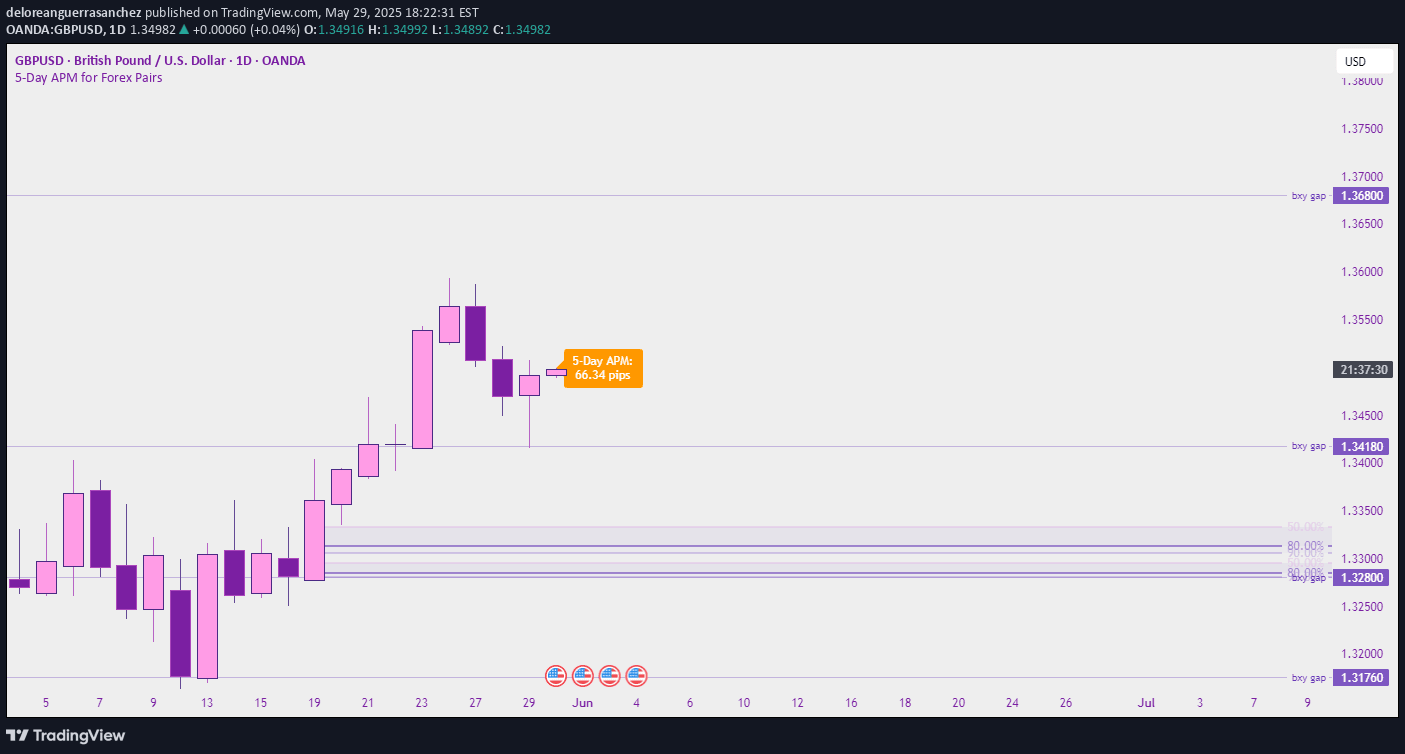
A trading indicator that displays opening price ranges for Asia, London, and New York trading sessions, helping traders identify market session-specific price boundaries and potential trading opportunities.
Explore complementary indicator rolesHow it works
The indicator tracks specific time windows for three major global trading sessions: Asia (18:00-18:15), London (03:00-03:15), and New York (09:30-09:45), plotting their opening price ranges on the chart. By marking these precise session intervals, traders can visually identify the initial price boundaries established during each market's opening minutes.
Traders can customize the number of days displayed and adjust color schemes for each session, making the visualization more intuitive and personalized. The indicator is specifically coded to New York time, ensuring accurate representation of global trading session opening ranges across different time zones.
Why it may be useful
Trading session opening ranges provide crucial insights into market sentiment, potential price momentum, and early directional signals for traders across different global markets. By visualizing these specific time windows, traders can quickly assess initial market dynamics and make more informed trading decisions based on the first few minutes of each session.
Understanding these opening ranges helps traders identify potential support and resistance levels, gauge market volatility, and develop more strategic entry and exit points. The indicator simplifies complex global market timing by presenting clear, visual representations of market session boundaries.
When to explore it
This indicator is most effective for traders focusing on short-term, high-frequency trading strategies that capitalize on market session transitions and early price movements. It is particularly useful for day traders and scalpers who aim to exploit quick price fluctuations during the initial minutes of major trading sessions.
Traders can benefit most from this tool when trading instruments closely tied to specific global markets, such as forex, indices, or stocks with significant international exposure. It is especially valuable during periods of high market volatility or when transitioning between different global trading sessions.
Keep exploring
What we’ve verified
Access, alerts and repainting behaviour have not been independently verified for this indicator. Check the creator’s current publication and settings.
General descriptions and classifications are recovered research. Verified details above identify the specific checks we have completed. Check the creator’s current publication for later changes.