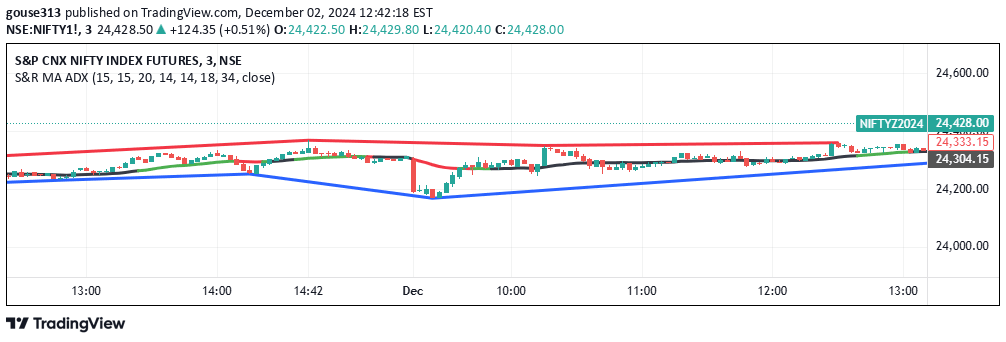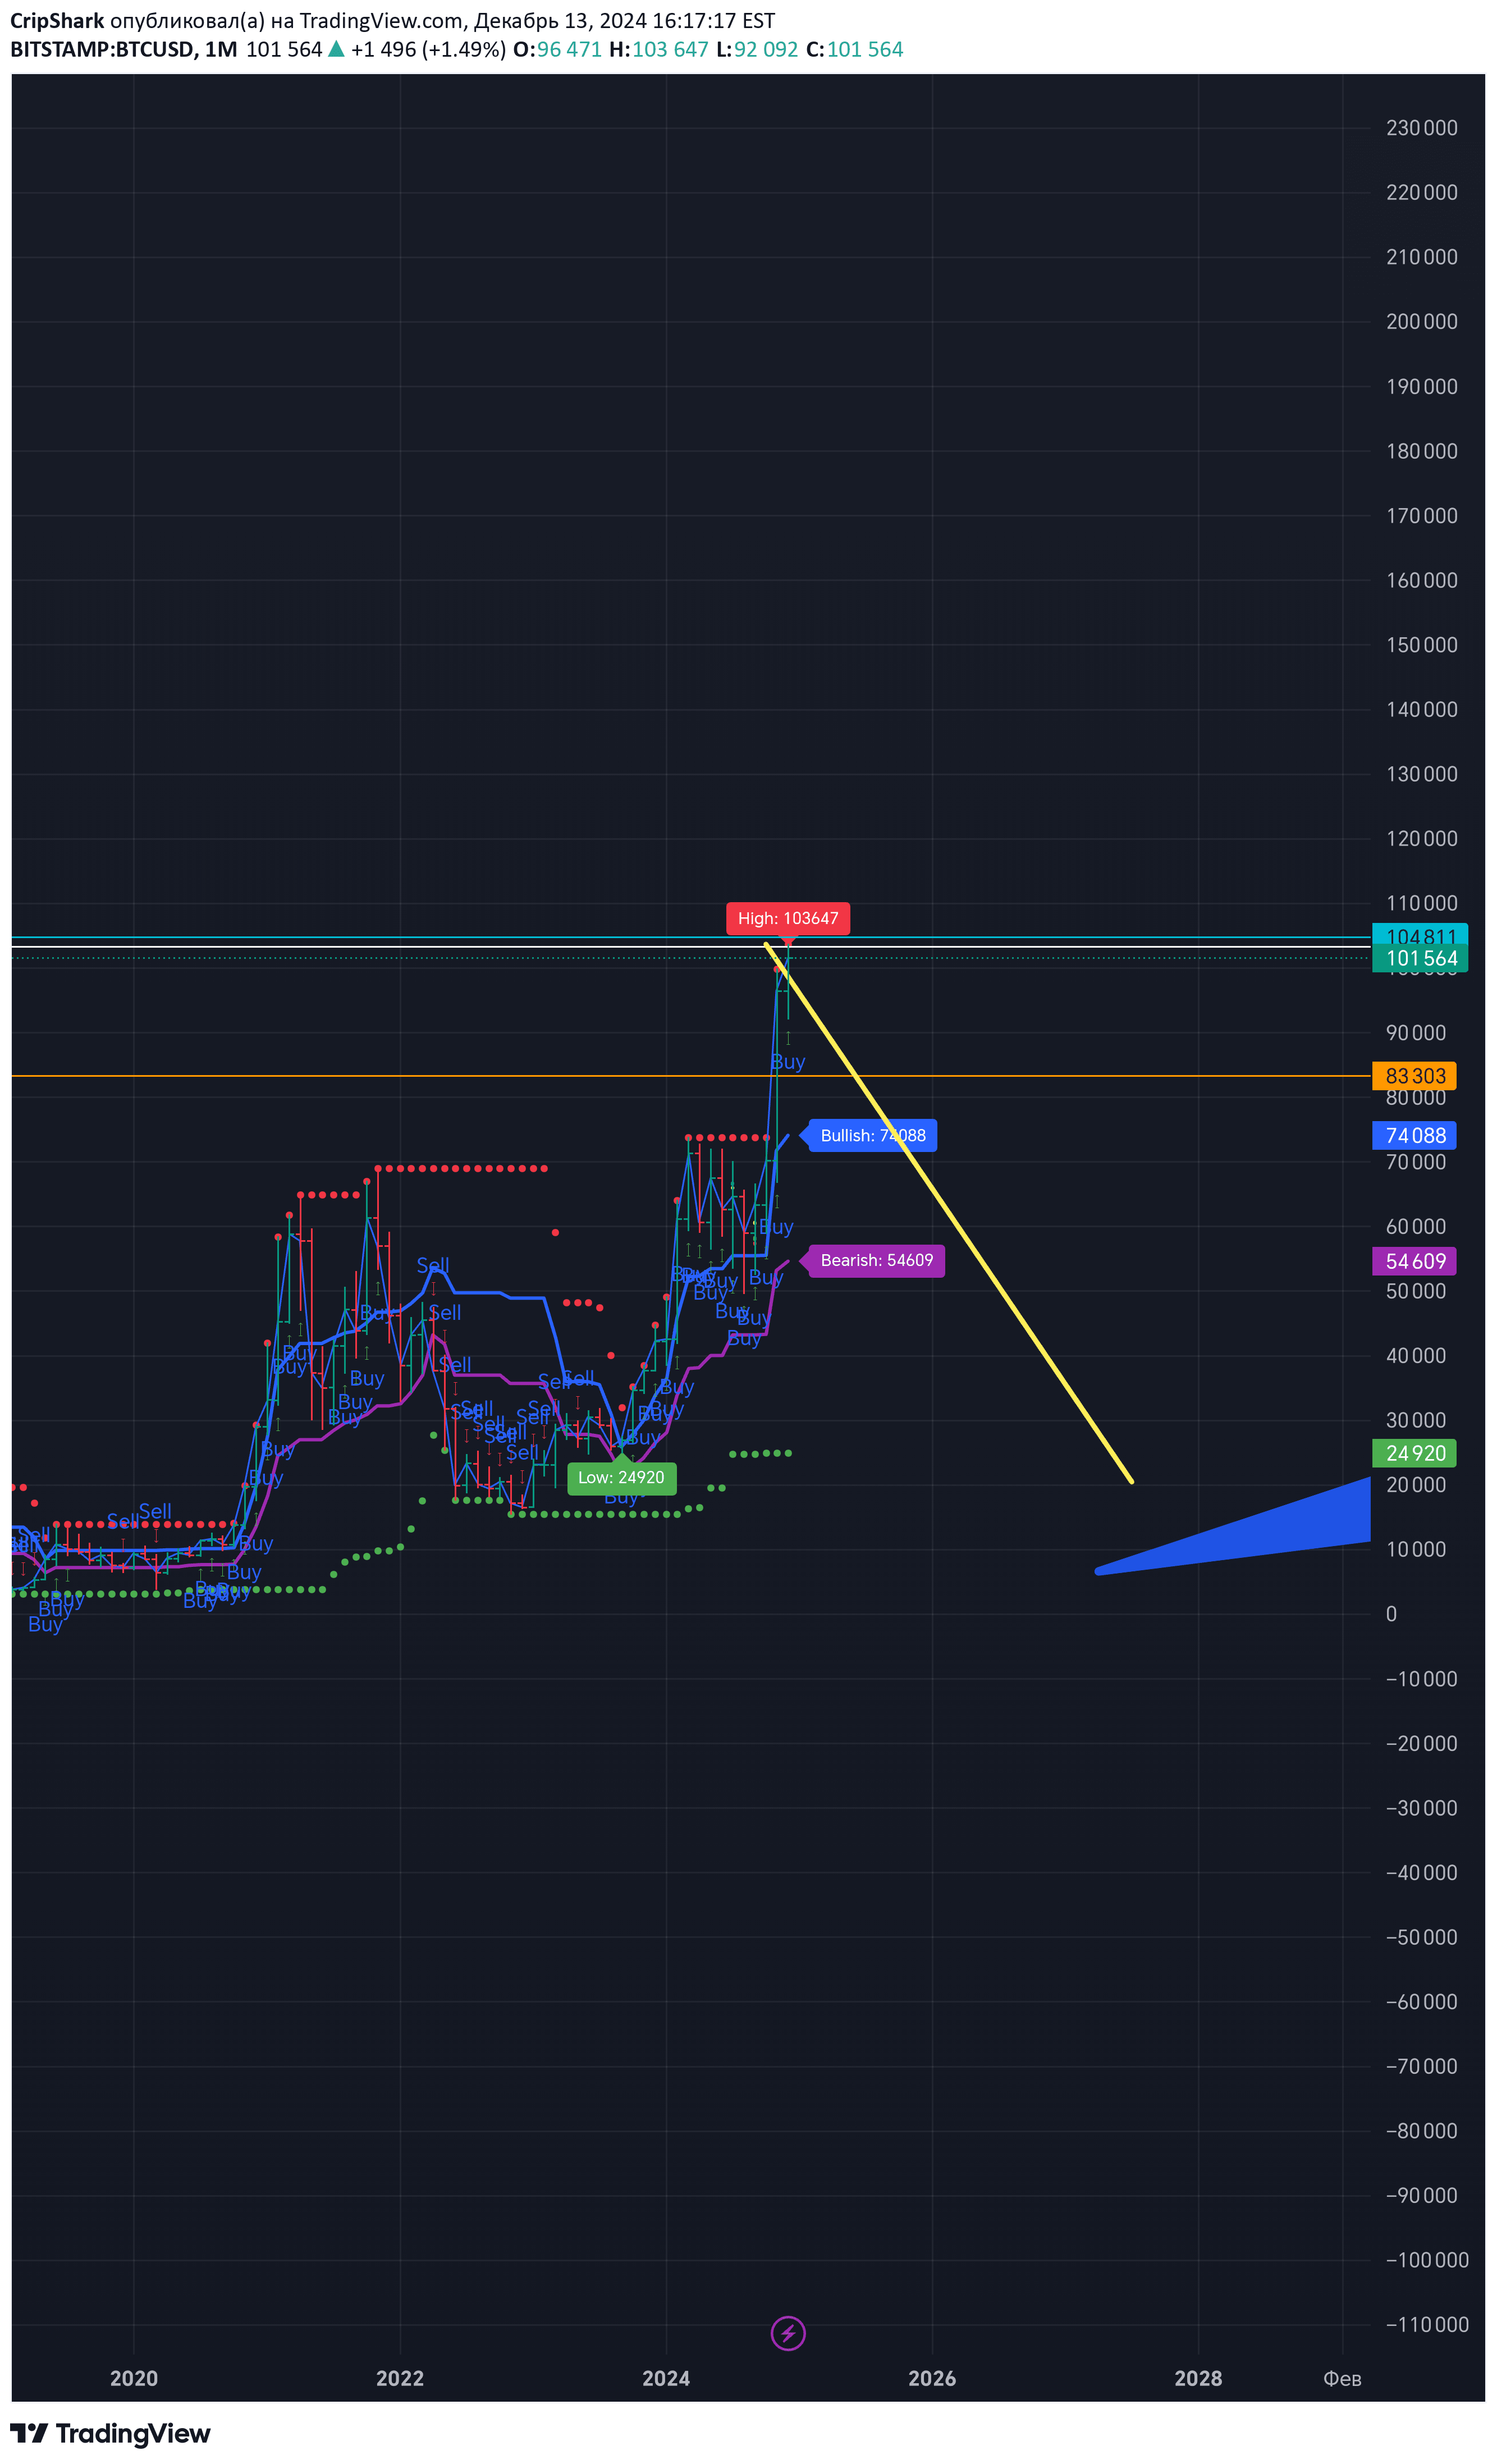
A trading indicator that detects local price extremes and predicts potential bullish and bearish targets using Volume Spread Analysis and Fibonacci levels for precise market entry points.
Explore complementary indicator rolesHow it works
The Shark Price & Bar Prediction Indicator analyzes price action by systematically identifying local high and low points within a specified prediction period. It utilizes Volume Spread Analysis (VSA) to calculate potential price targets using Fibonacci levels, which help traders understand potential market movements.
The indicator generates visual signals by marking the highest and lowest points with colored circles and drawing predictive lines for bullish and bearish targets. By comparing current price action against these calculated levels, traders can quickly assess potential entry and exit points with enhanced visual clarity.
Why it may be useful
This indicator provides traders with a comprehensive tool for understanding market dynamics by combining multiple analytical techniques into a single, easy-to-interpret visual representation. By integrating local extremes detection, volume analysis, and Fibonacci targeting, it offers traders a nuanced view of potential price movements that goes beyond traditional single-method indicators.
The ability to customize prediction periods and confidence thresholds allows traders to adapt the indicator to their specific trading style and market conditions, making it a versatile tool for different trading approaches and asset classes.
When to explore it
The Shark Price & Bar Prediction Indicator is most effective in markets with clear trend structures and sufficient price volatility, such as forex, stocks, and cryptocurrency markets. It performs best when used on timeframes that provide enough historical data to identify meaningful local extremes, typically ranging from 1-hour to daily charts.
Traders should use this indicator in conjunction with other technical analysis tools to confirm signals and validate potential trade setups. It is particularly useful during trending market conditions where price is likely to respect Fibonacci levels and show predictable movement patterns.
Keep exploring
What we’ve verified
Access, alerts and repainting behaviour have not been independently verified for this indicator. Check the creator’s current publication and settings.
General descriptions and classifications are recovered research. Verified details above identify the specific checks we have completed. Check the creator’s current publication for later changes.