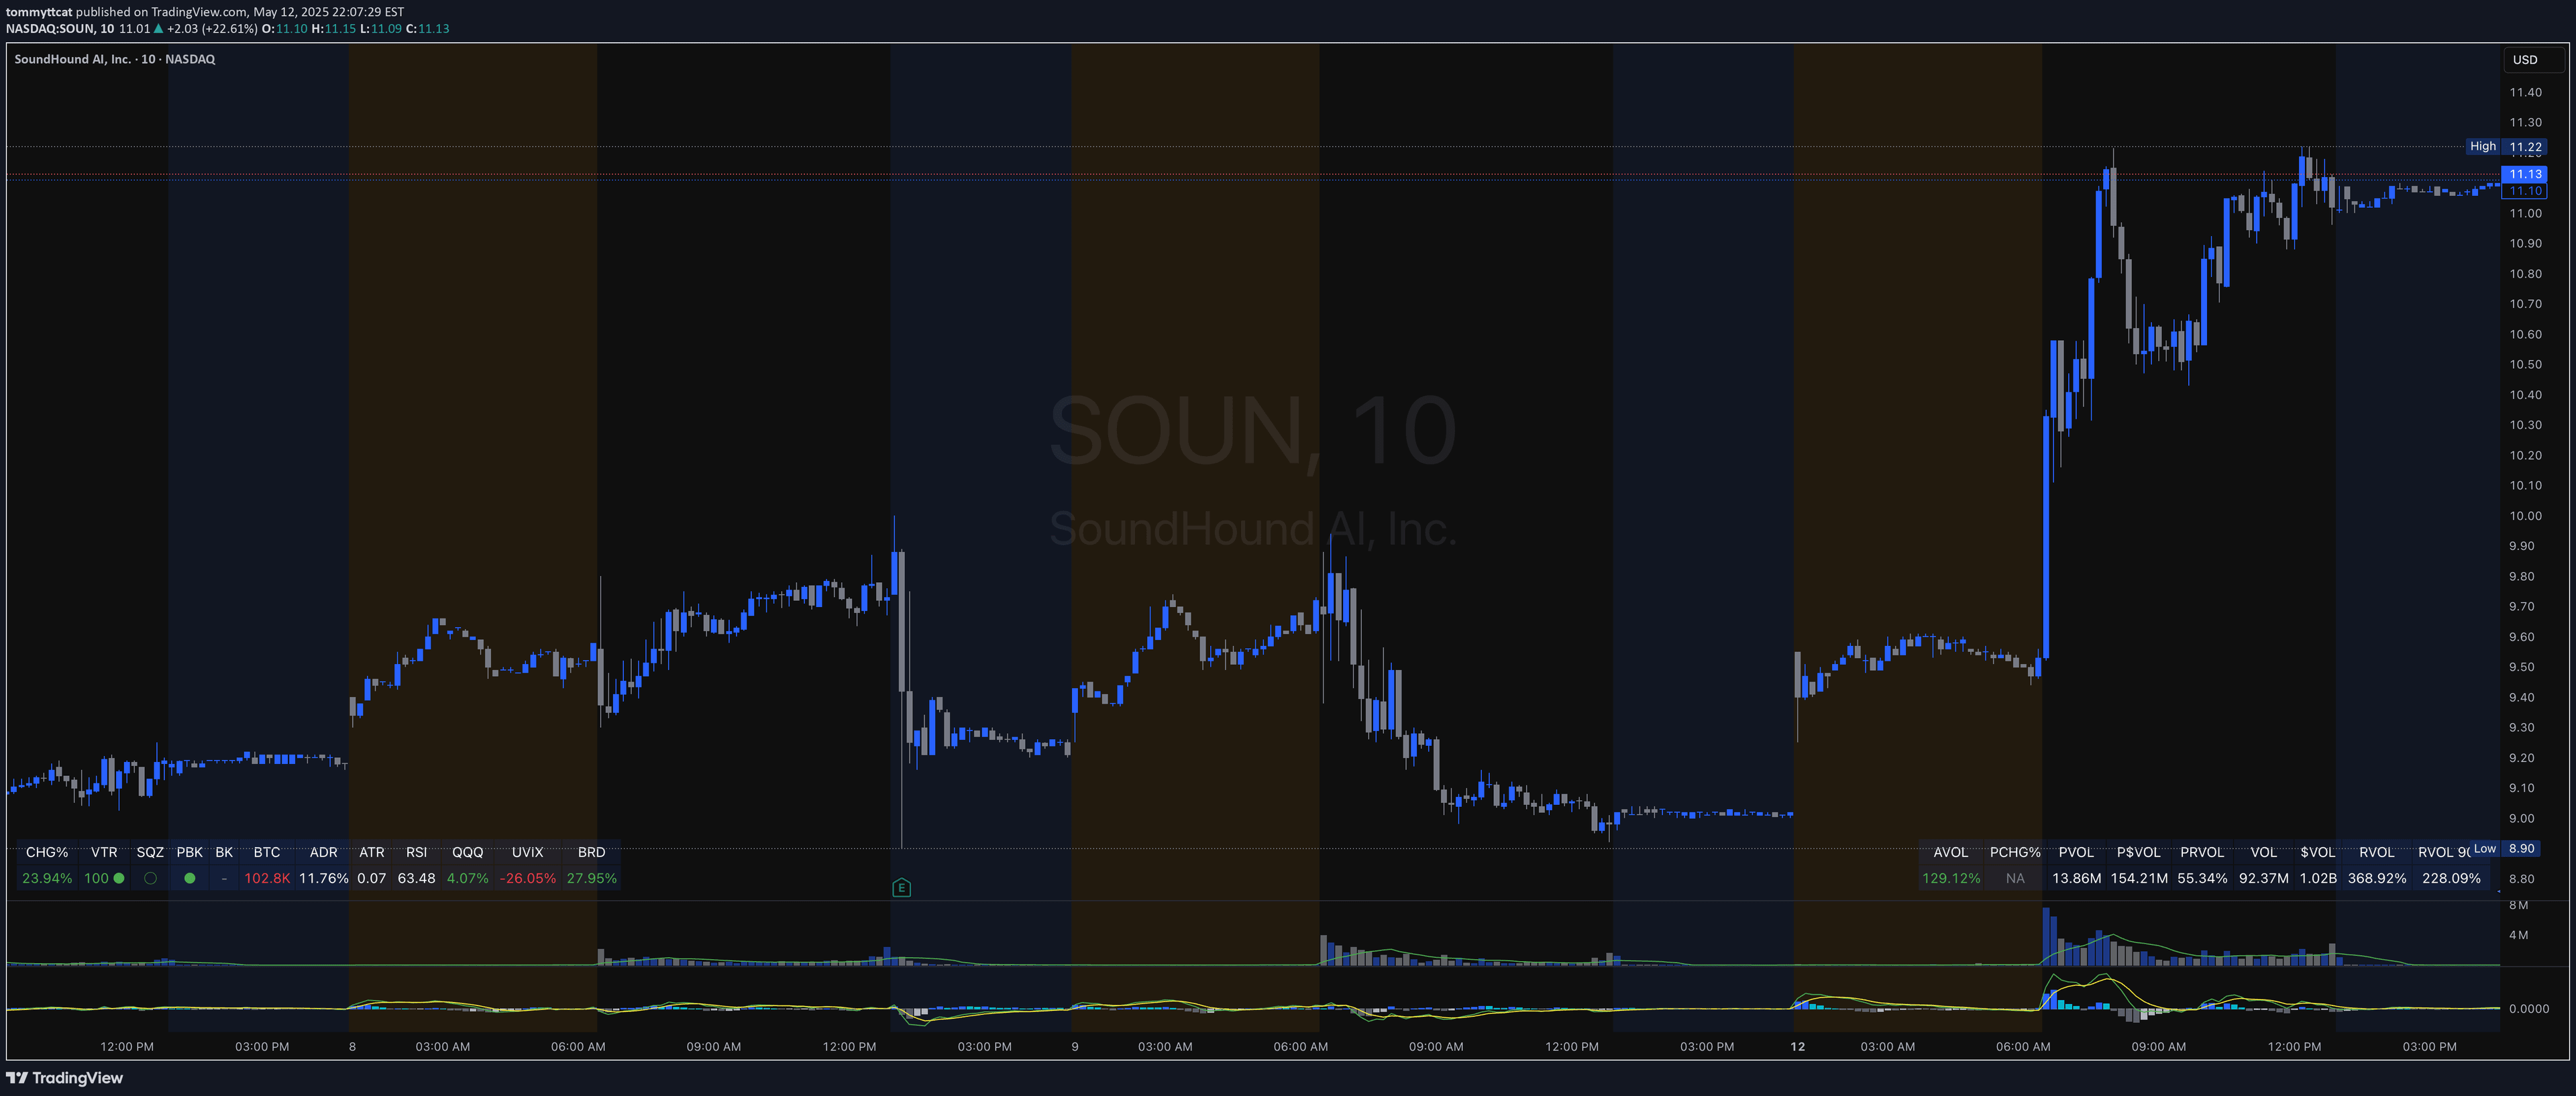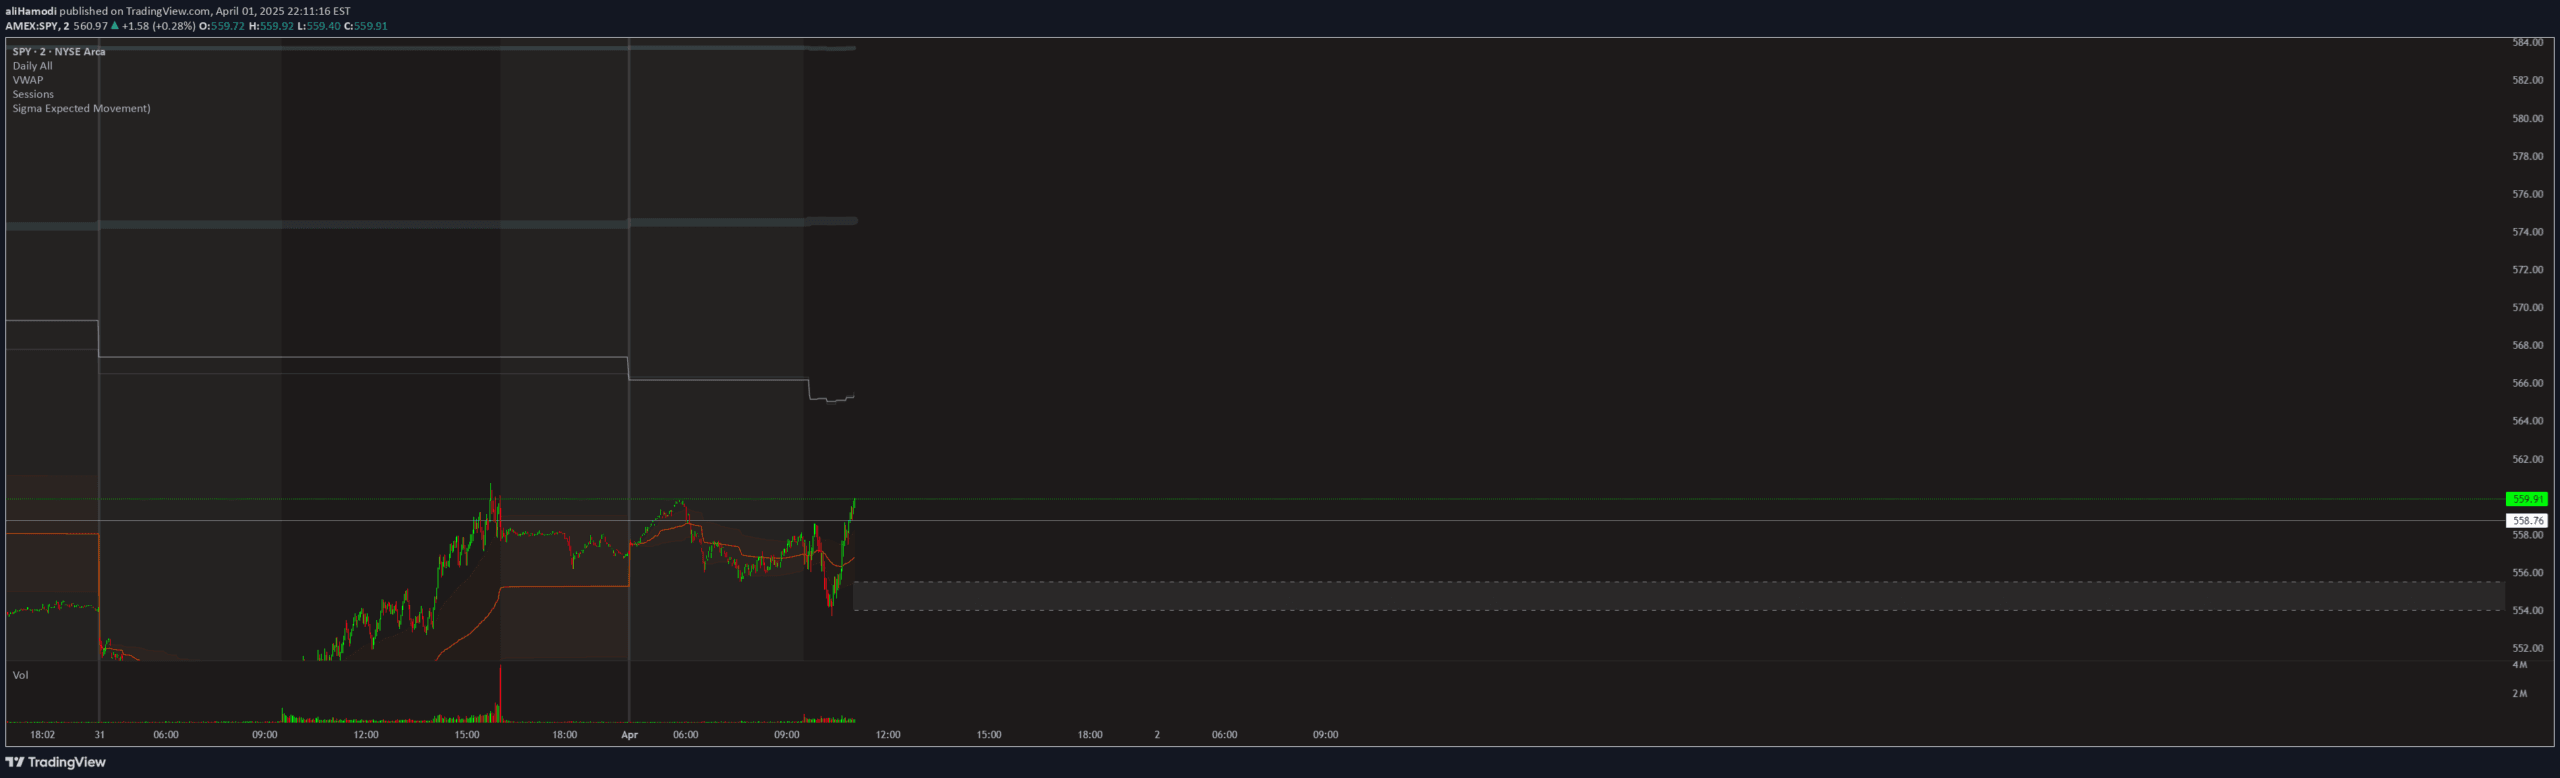
A volatility-based indicator that calculates expected price movement ranges using VIX index data, helping traders visualize potential price range and market volatility across different timeframes.
Explore complementary indicator rolesHow it works
The indicator calculates expected price movement ranges by leveraging VIX index data, allowing traders to select specific timeframes like daily, weekly, or monthly periods. It uses configurable center price sources such as today's open or previous close to establish a baseline for calculations.
Traders can customize deviation levels using percentages, with up to three distinct levels that represent potential price movement zones. The indicator offers flexible visualization options, including line styles, colors, and opacity, enabling users to tailor the visual representation of expected price ranges to their specific trading preferences.
Why it may be useful
Understanding potential price movement ranges helps traders make more informed decisions about market volatility and potential price action. By providing a visual representation of expected price movements, the indicator allows traders to set more strategic entry and exit points with greater confidence.
The flexible customization options mean traders can adapt the indicator to different market conditions and personal trading styles, making it a versatile tool for analyzing potential market volatility across various timeframes and trading approaches.
When to explore it
This indicator is most effective during periods of significant market uncertainty or when traders want to establish potential price movement boundaries. It works particularly well in markets with identifiable volatility patterns, such as around economic announcements or during trending market conditions.
Traders can leverage this tool across different timeframes, making it suitable for scalping, day trading, and swing trading strategies. It is especially useful when combined with other technical analysis tools to provide a more comprehensive view of potential market movements.
Keep exploring
What we’ve verified
Access, alerts and repainting behaviour have not been independently verified for this indicator. Check the creator’s current publication and settings.
General descriptions and classifications are recovered research. Verified details above identify the specific checks we have completed. Check the creator’s current publication for later changes.