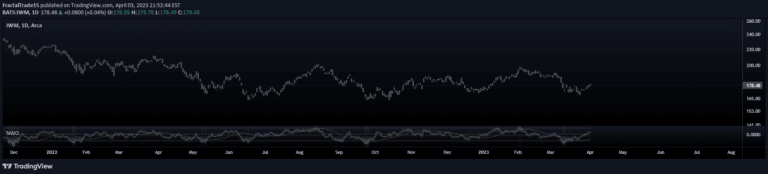
A dynamic visual indicator using sinusoidal waves and color gradients to represent market movements, providing an aesthetic and interpretive chart enhancement.
Explore complementary indicator rolesHow it works
The Solar Movement Gradient Indicator generates a sinusoidal wave that oscillates based on time or price movements, creating a smooth, dynamic representation of market behavior. The wave's characteristics can be customized through adjustable parameters like amplitude, baseline, and wavelength, allowing traders to fine-tune the visual representation.
The indicator incorporates a sophisticated color gradient system that transitions through seven colors, mimicking solar spectrum transitions. As the wave moves, colors shift seamlessly, providing a visually engaging method of tracking underlying market dynamics without generating direct trading signals.
Why it may be useful
This indicator transforms traditional chart analysis by introducing a visually compelling method of representing market movements, making technical analysis more engaging and potentially more intuitive for visual learners. Its unique approach can help traders maintain interest and focus during lengthy chart examinations, potentially reducing fatigue and improving observation skills.
While not generating direct trading signals, the indicator serves as an innovative visualization tool that can complement other technical analysis methods, offering a fresh perspective on market behavior and encouraging more creative approaches to chart interpretation.
When to explore it
The Solar Movement Gradient Indicator is best used as a supplementary visual tool for traders who appreciate aesthetic chart representations and seek alternative ways of understanding market dynamics. It can be particularly useful during periods of market consolidation or when traders want to maintain visual engagement with their charts.
Traders should view this indicator as a complementary visualization technique rather than a primary trading signal generator. It works best when combined with other technical indicators and analysis methods, serving to enhance chart aesthetics and potentially provide subtle insights into market movements.
Keep exploring
What we’ve verified
Access, alerts and repainting behaviour have not been independently verified for this indicator. Check the creator’s current publication and settings.
General descriptions and classifications are recovered research. Verified details above identify the specific checks we have completed. Check the creator’s current publication for later changes.