
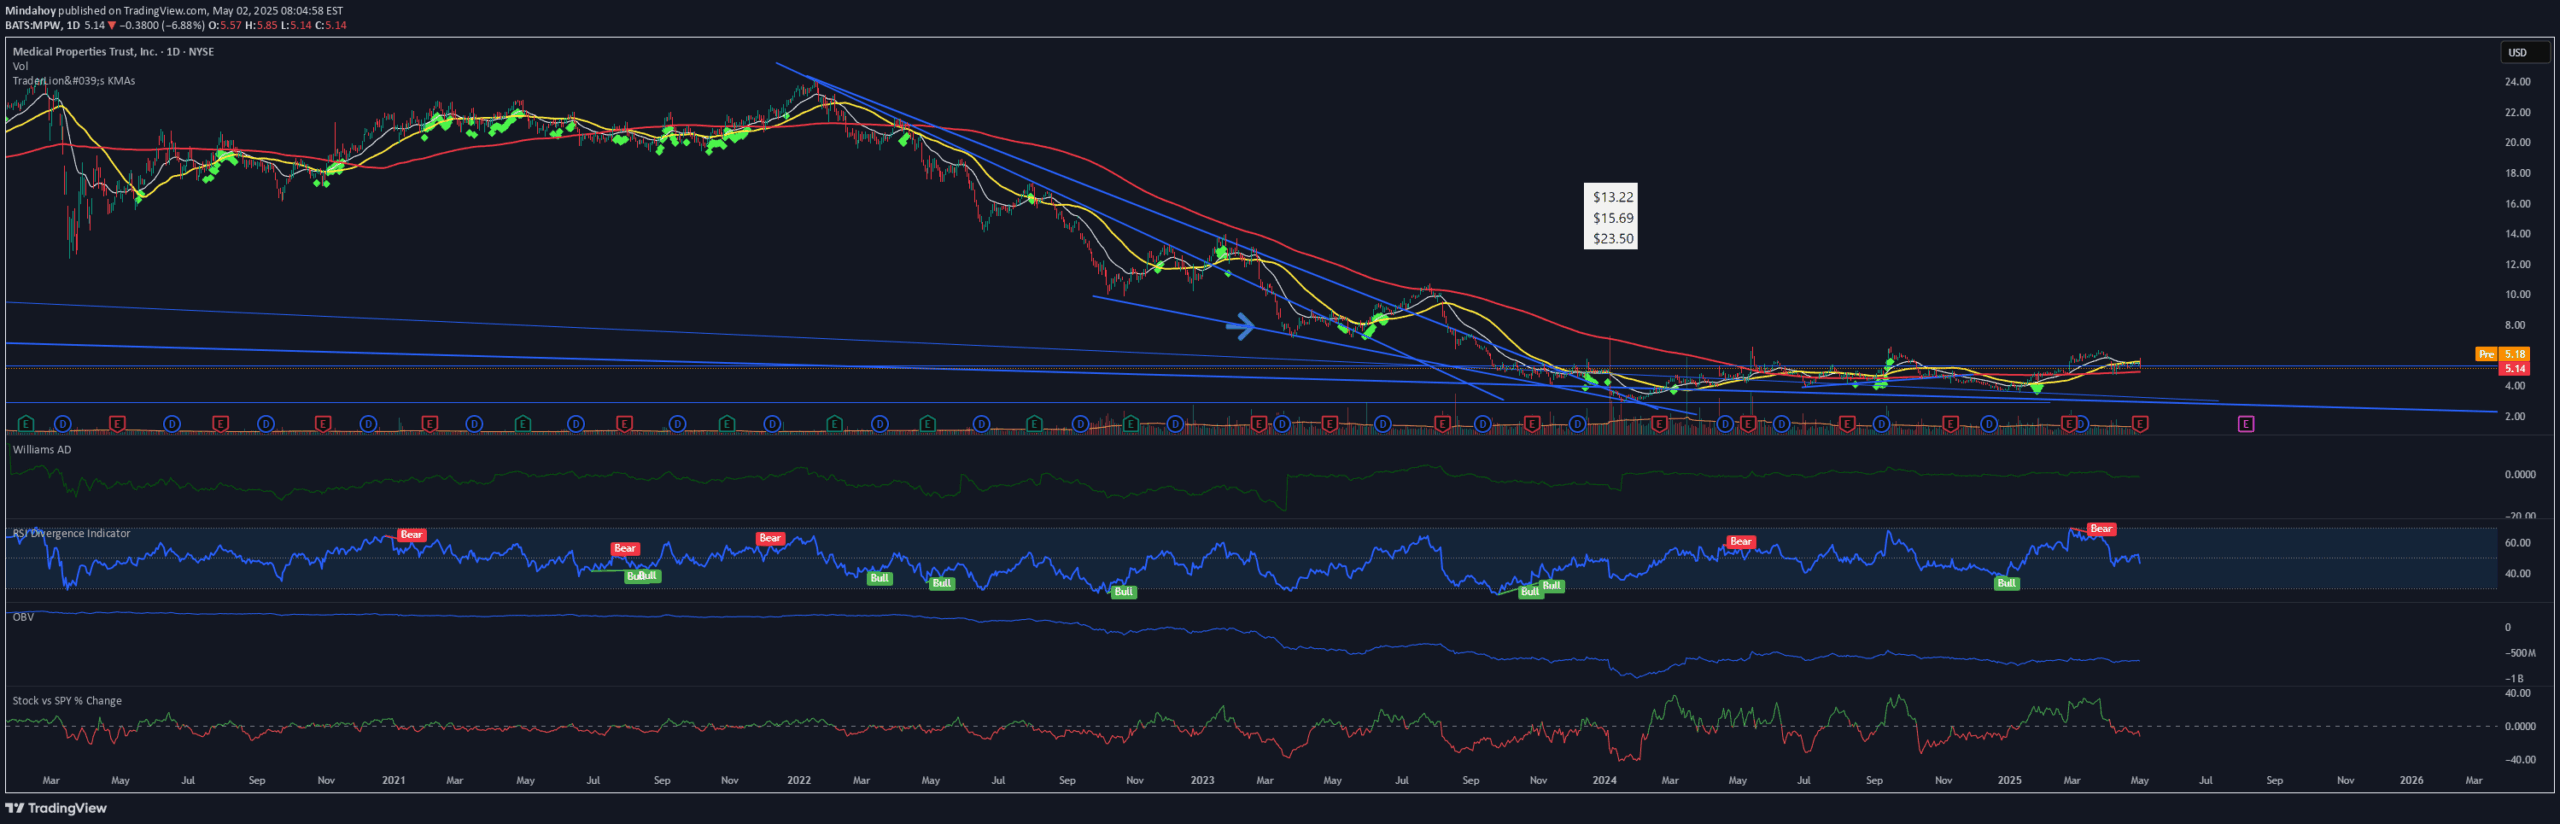
A comparative indicator that measures a stock's performance against the S&P 500, highlighting relative strength through percentage price change analysis over a specified period.
Explore complementary indicator rolesHow it works
The Stock vs SPY % Change Indicator calculates the percentage price change for both a specific stock and the SPY ETF over a user-defined lookback period, typically 20 days. It compares these percentage changes to determine the stock's relative performance against the broader market benchmark.
The indicator plots the difference between the stock's and SPY's percentage changes, using a zero line as a reference point. When the plot is above zero and colored green, it indicates the stock is outperforming SPY, while a red plot below zero suggests underperformance relative to the market.
Why it may be useful
This indicator provides traders with a quick and visual method to assess a stock's strength compared to the broader market, offering insights into relative performance during different market conditions. It helps investors identify stocks that demonstrate resilience or exceptional performance, whether during market downturns or uptrends.
By highlighting stocks that consistently outperform or underperform the S&P 500, traders can make more informed decisions about potential investments, portfolio allocation, and overall market sentiment. The indicator serves as a valuable tool for relative strength analysis and can help identify stocks experiencing accumulation or distribution.
When to explore it
The Stock vs SPY % Change Indicator is most effective when used on daily or weekly charts to analyze medium-term performance trends. It is particularly useful during volatile market conditions when comparing individual stock performance to the broader market benchmark becomes crucial.
Traders should apply this indicator when seeking to understand a stock's relative strength, evaluate portfolio composition, or identify potential investment opportunities. It is especially valuable during periods of market uncertainty, helping investors distinguish between stocks that are maintaining or improving their market position and those that are lagging behind.
Keep exploring
What we’ve verified
Access, alerts and repainting behaviour have not been independently verified for this indicator. Check the creator’s current publication and settings.
General descriptions and classifications are recovered research. Verified details above identify the specific checks we have completed. Check the creator’s current publication for later changes.


