
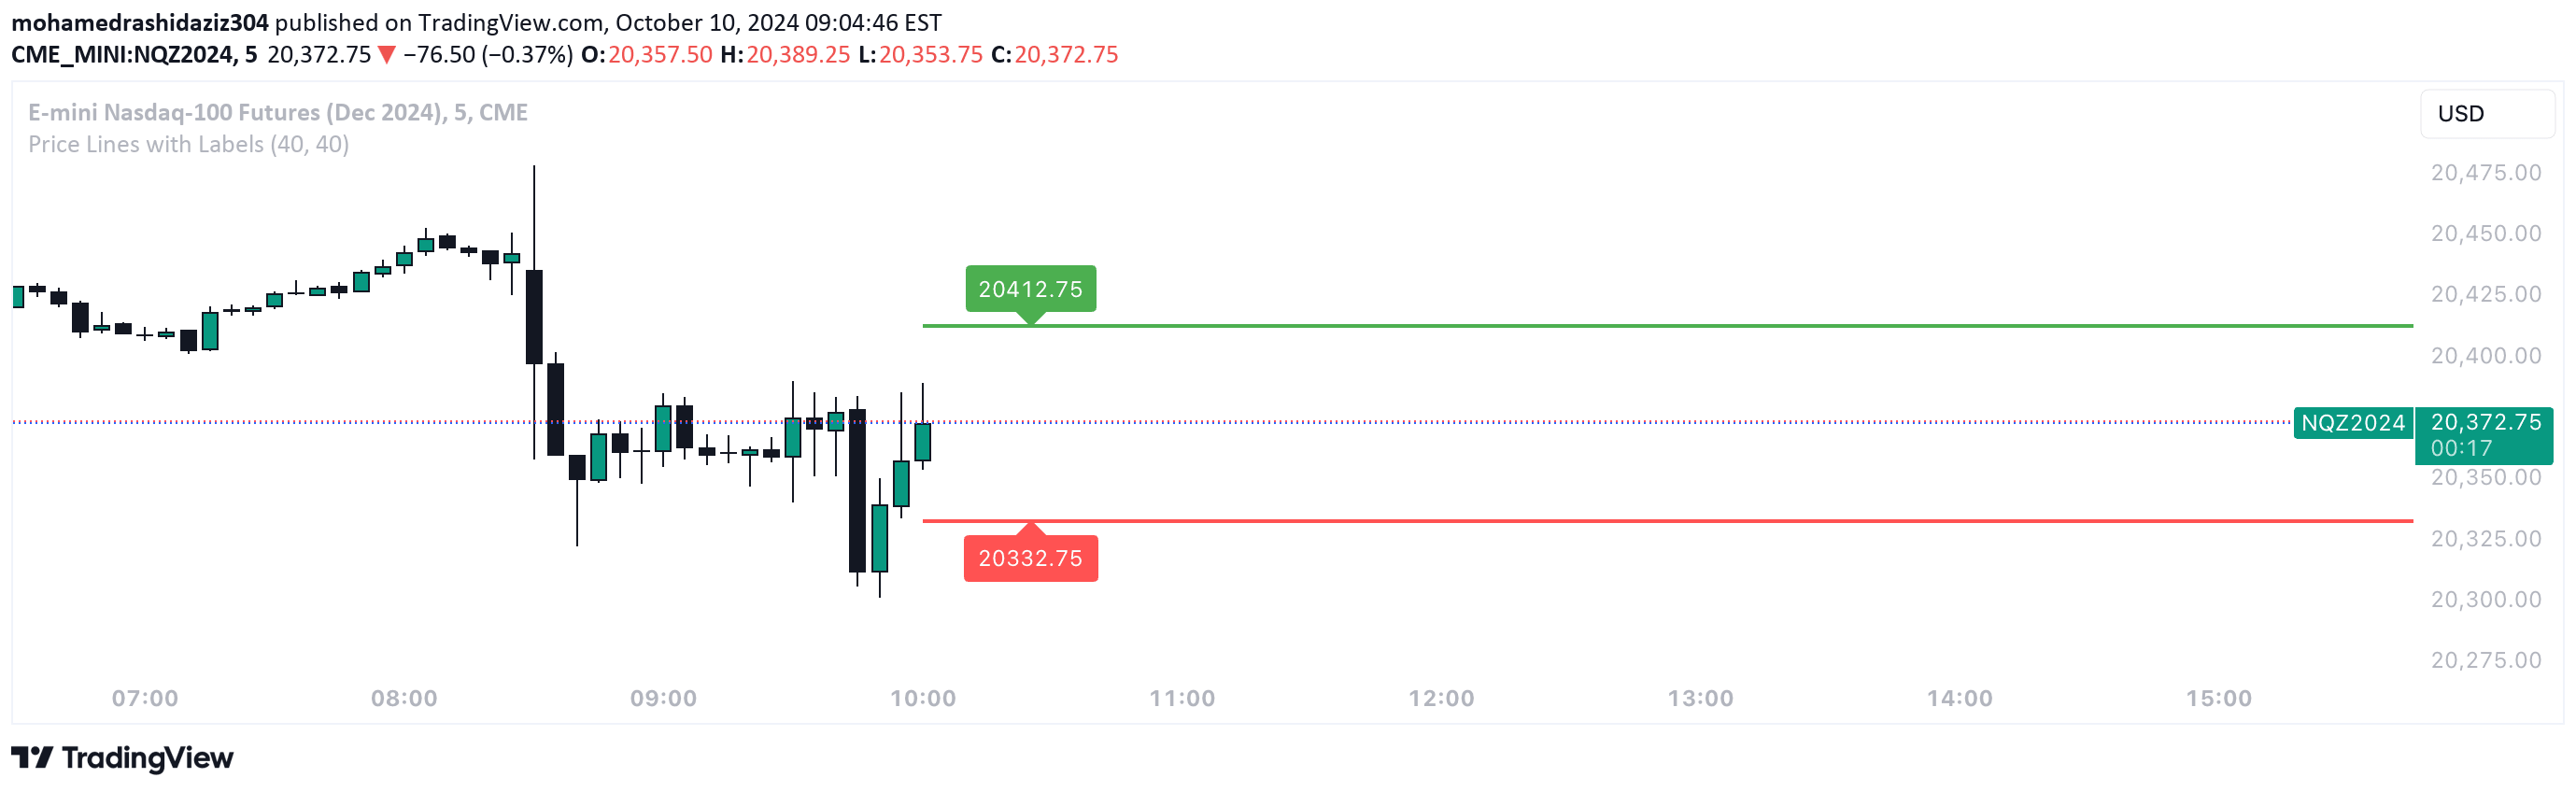
A dynamic straddle indicator that draws price lines above and below the current price, helping traders visualize potential market movements and plan entries or exits strategically.
Explore complementary indicator rolesHow it works
The Straddle Indicator operates by calculating horizontal lines positioned symmetrically around the current market price using customizable offsets. Traders can define specific distances above and below the current closing price, creating visual reference points that dynamically adjust with market conditions.
These lines are color-coded for easy interpretation, with green representing the upper level and red representing the lower level. Each line is accompanied by a precise price label, allowing traders to quickly understand the exact price levels and potential trading ranges without complex calculations.
Why it may be useful
The Straddle Indicator provides traders with an immediate visual representation of potential price movement boundaries, helping them quickly assess market volatility and potential trading opportunities. By offering a clear, customizable view of price levels, traders can make more informed decisions about entry and exit points.
This indicator is particularly valuable for traders who need to quickly understand market dynamics and potential price ranges. Its real-time adaptability and straightforward visual presentation make it an essential tool for traders seeking to understand immediate market conditions and potential trading strategies.
When to explore it
The Straddle Indicator is most effective in markets with moderate volatility where price movements are somewhat predictable and traders want to establish clear reference points. It works best when traders have a specific strategy for utilizing upper and lower price boundaries in their trading approach.
Traders can optimize this indicator during trending or range-bound markets, where understanding potential price movement limits becomes crucial. It is particularly useful for short-term trading strategies that require quick, visual assessments of potential price action and market sentiment.
Keep exploring
What we’ve verified
Access, alerts and repainting behaviour have not been independently verified for this indicator. Check the creator’s current publication and settings.
General descriptions and classifications are recovered research. Verified details above identify the specific checks we have completed. Check the creator’s current publication for later changes.


