
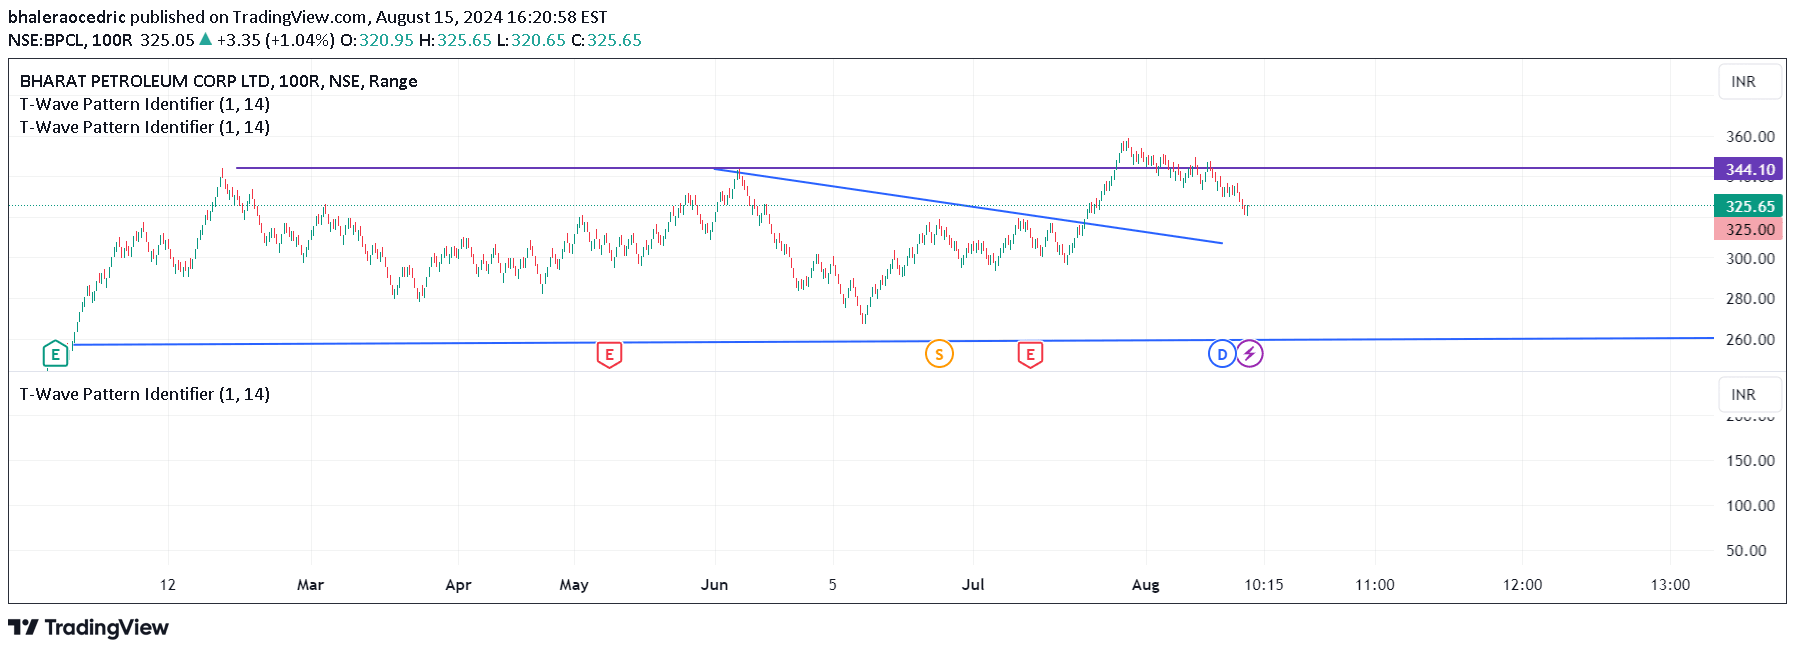
A T-wave pattern identifies sharp vertical price movements followed by horizontal consolidation, signaling potential breakout or reversal opportunities in trading.
Explore complementary indicator rolesHow it works
The T-wave pattern begins with a strong vertical price movement representing the 'stem' of the T, which indicates significant momentum in a single direction. This initial move is typically characterized by a large-bodied candle with minimal wicks, showing decisive market sentiment.
Following the vertical movement, the price enters a horizontal consolidation phase forming the 'cross' of the T. During this phase, price moves within a narrow range, creating overlapping candles that suggest market indecision or potential preparation for the next significant move.
Why it may be useful
The T-wave pattern provides traders with a visual representation of market dynamics, helping them understand momentum shifts and potential trend continuations or reversals. By identifying these distinctive price movements, traders can anticipate potential breakout scenarios and make more informed trading decisions.
This pattern is particularly valuable because it captures both the initial strong price movement and the subsequent consolidation period, offering insights into market psychology and potential future price action. Traders can use this pattern to develop strategic entry and exit points with enhanced precision.
When to explore it
The T-wave pattern is most effective in markets with clear directional movements and periods of high volatility. It works best in markets like stocks, forex, and cryptocurrency, where sharp price changes are common and can be quickly identified.
Traders should apply this pattern during times of significant market events, economic announcements, or when there are clear technical triggers that might cause rapid price movements. It is particularly useful for short-term trading strategies that aim to capitalize on quick market momentum shifts.
Keep exploring
What we’ve verified
Access, alerts and repainting behaviour have not been independently verified for this indicator. Check the creator’s current publication and settings.
General descriptions and classifications are recovered research. Verified details above identify the specific checks we have completed. Check the creator’s current publication for later changes.


