
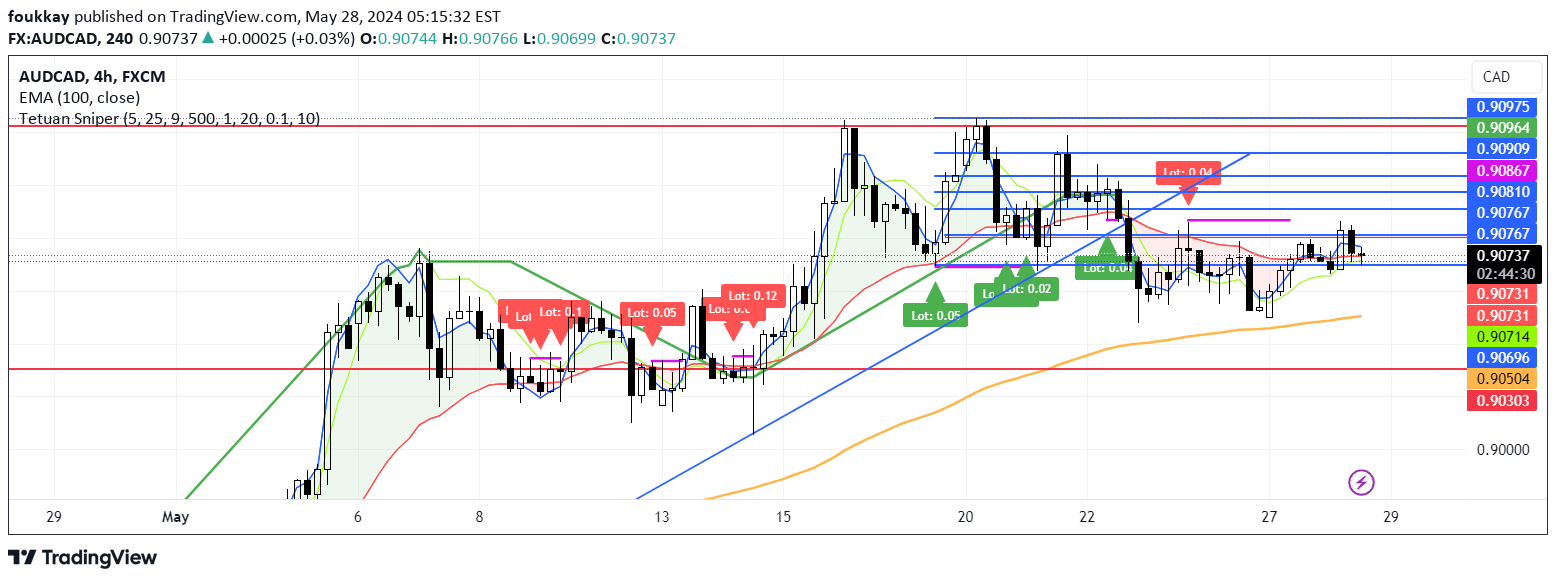
A trading strategy using TEMA and EMA crossovers to generate buy and sell signals with dynamic stop loss and take profit levels, optimizing trade management and risk control.
Explore complementary indicator rolesHow it works
The strategy identifies trading signals by monitoring the crossover between Triple Exponential Moving Average (TEMA) and Exponential Moving Average (EMA). When TEMA crosses above EMA, a buy signal is generated, and when TEMA crosses below EMA, a sell signal is triggered. The strategy dynamically calculates stop loss and take profit levels based on predefined pip distances and market conditions.
Lot size calculation is performed by considering the trader's account balance, risk percentage, and maximum open orders. This ensures precise position sizing and risk management. For JPY pairs, the lot size is adjusted by dividing by 100 to account for different pip values, and the final lot size is rounded to two decimal places for accuracy.
Why it may be useful
This strategy provides traders with a systematic approach to market entry and exit, reducing emotional decision-making and implementing disciplined trading. By using multiple moving averages, it helps identify trend changes and potential momentum shifts more effectively than single moving average strategies.
The dynamic risk management features, including adaptive stop loss and take profit levels, help traders control potential losses while allowing profits to run. The precise lot size calculation ensures that each trade is proportional to the account balance and risk tolerance, promoting consistent and sustainable trading performance.
When to explore it
The TEMA and EMA Crossover strategy is most effective in trending markets with clear directional movement, where moving averages can effectively capture momentum shifts. It works best in markets with moderate volatility, where price trends are more pronounced and sustained.
Traders should preferably use this strategy on timeframes ranging from 15 minutes to daily charts, as shorter timeframes might generate more noise and false signals. It is particularly suitable for currency pairs and financial instruments that exhibit relatively smooth trending behavior, such as major forex pairs and some commodity and index markets.
Keep exploring
What we’ve verified
Access, alerts and repainting behaviour have not been independently verified for this indicator. Check the creator’s current publication and settings.
General descriptions and classifications are recovered research. Verified details above identify the specific checks we have completed. Check the creator’s current publication for later changes.


