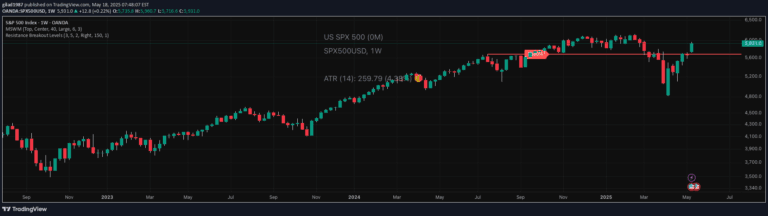
An advanced trading tool that automatically detects dynamic support and resistance levels using pivot points and generates trend lines based on recent price action and market structure.
Explore complementary indicator rolesHow it works
The script identifies pivot points by analyzing price action across a configurable number of left and right bars. A pivot high or low is confirmed when surrounding candles meet specific height criteria, with triangles plotted to mark these critical support and resistance levels.
As more levels are confirmed, the system dynamically draws trendlines connecting the most recent support and resistance points. These trendlines are color-coded to indicate trend strength, with variations showing whether the trend is upward, downward, or neutral based on slope and price relationship.
Why it may be useful
This tool provides traders with a dynamic and adaptive method of identifying key market structure points that can signal potential trend reversals or continuations. By automatically detecting and visualizing support, resistance, and trend lines, traders can quickly assess market sentiment and potential entry or exit points without manual intervention.
The color-coded visualization allows traders to rapidly understand trend strength and direction, reducing cognitive load and enabling faster decision-making across different trading timeframes and market conditions.
When to explore it
The indicator works best in markets with clear directional movements and well-defined price action, such as forex, stocks, and cryptocurrencies. Traders can leverage this tool most effectively in trending markets where support and resistance levels play a crucial role in price dynamics.
It is particularly useful during periods of market volatility, when rapid identification of key levels and trend changes can provide significant trading advantages. Adjusting the sensitivity parameters allows traders to customize the indicator's performance across different timeframes and asset classes.
Keep exploring
What we’ve verified
Access, alerts and repainting behaviour have not been independently verified for this indicator. Check the creator’s current publication and settings.
General descriptions and classifications are recovered research. Verified details above identify the specific checks we have completed. Check the creator’s current publication for later changes.