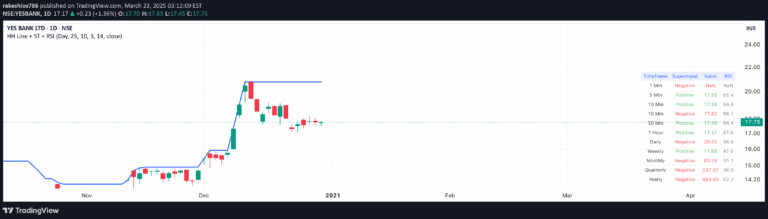
A short-trading pullback strategy that identifies potential reversal zones by analyzing multiple price rejections and tracking minimum pullback percentages across different timeframes.
Explore complementary indicator rolesHow it works
The pullback detection strategy works by first identifying price zones with high rejection potential through analyzing multiple historical price points. It establishes a specific zone with upper and lower boundaries and tracks price movements to determine valid pullback opportunities.
The indicator calculates pullback percentages and monitors price behavior within the predefined zone, generating signals when specific conditions are met. By tracking minimum pullback requirements and using customizable lookback periods, the strategy provides early warnings for potential short trade entries.
Why it may be useful
This strategy offers traders a systematic approach to identifying potential market reversals and short-entry opportunities with predefined parameters. By providing early pullback detection, traders can anticipate price movements and make more informed trading decisions across different timeframes.
The indicator's flexibility allows customization for various market conditions, enabling traders to adapt the strategy to different asset classes and trading styles. Its ability to generate early signals helps traders manage risk and potentially capture quick scalping opportunities.
When to explore it
The pullback strategy works best in ranging markets where price movements show consistent rejection patterns and predictable oscillations. Traders should focus on timeframes between 1-minute and 15-minute charts for optimal results, as these periods provide sufficient price action for accurate signal generation.
Ideal usage includes identifying short-term trading opportunities, managing existing positions, and generating early warning signals for potential market reversals. Traders should combine this indicator with other technical analysis tools to confirm signals and improve overall trading performance.
Keep exploring
What we’ve verified
Access, alerts and repainting behaviour have not been independently verified for this indicator. Check the creator’s current publication and settings.
General descriptions and classifications are recovered research. Verified details above identify the specific checks we have completed. Check the creator’s current publication for later changes.