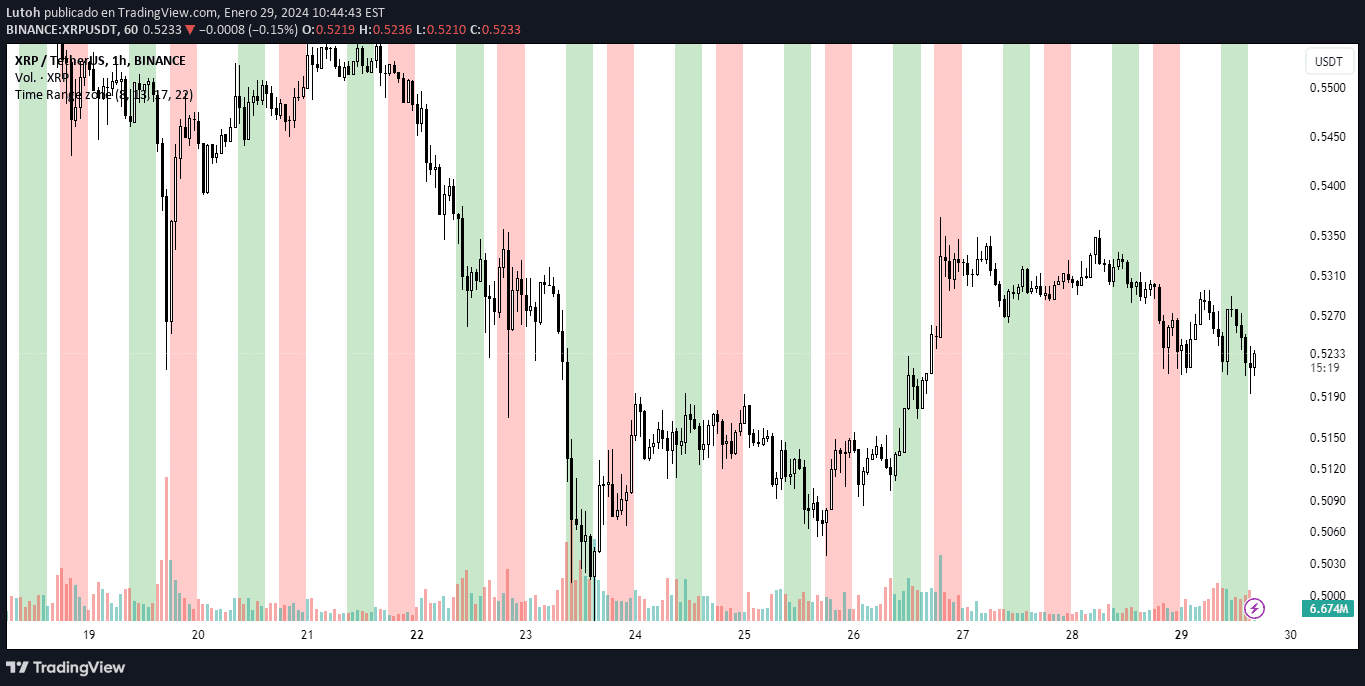
A TradingView script that highlights two specific time zones on a chart with colored backgrounds, designed for a personal XRP trading strategy.
Explore complementary indicator rolesHow it works
The script creates two distinct time zones on the trading chart, with the first zone running from 8:00 AM to 1:00 PM and the second zone from 5:00 PM to 10:00 PM. When the current time falls within either of these predefined zones, the script automatically applies a color-coded background to the chart.
For the first time zone, a green background is displayed, while the second time zone triggers a red background. This visual indication helps traders quickly identify and focus on specific trading periods that are most relevant to their strategy.
Why it may be useful
Time-based trading strategies can be crucial for capturing optimal market conditions and managing trading opportunities more effectively. By highlighting specific time zones, traders can quickly recognize periods that align with their preferred trading approach and market dynamics.
The color-coded backgrounds provide an immediate visual cue that helps traders stay focused and disciplined, reducing the cognitive load of constantly checking time and potentially missing important trading windows.
When to explore it
This script is particularly useful for traders who have identified specific time periods with historically better trading performance or market conditions. It is especially beneficial for cryptocurrency traders like XRP investors who want to concentrate their trading activities during predetermined time windows.
Traders can customize the time zones to match their personal trading strategy, market analysis, or observed patterns of liquidity and price movement. The visual indication helps maintain trading discipline and focus during the most promising market hours.
Keep exploring
What we’ve verified
Access, alerts and repainting behaviour have not been independently verified for this indicator. Check the creator’s current publication and settings.
General descriptions and classifications are recovered research. Verified details above identify the specific checks we have completed. Check the creator’s current publication for later changes.