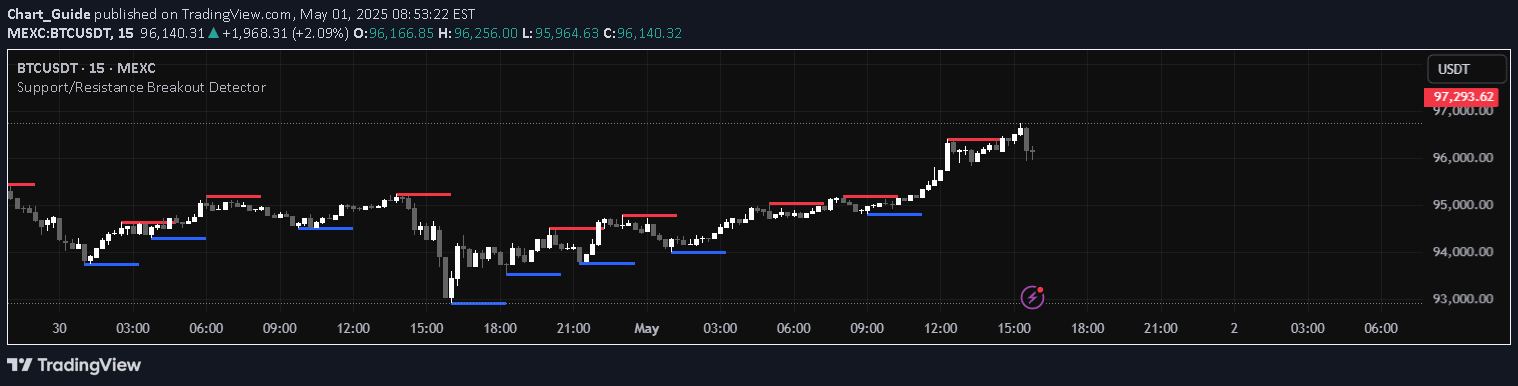
A trading channel indicator that plots support and resistance pivots around price action, providing a visual framework for developing trading strategies across different timeframes.
Explore complementary indicator rolesHow it works
The Trading Channel script generates a dynamic channel based on the maximum and minimum closing prices of the last 21 periods, creating a yellow middle line with green and red support and resistance lines. It incorporates multiple moving averages (SMA and EMA), pivot points, and various trend indicators to help traders visualize price action within a structured framework.
The indicator includes additional features like extended time period channels, resistance and support pivots based on John L. Person's studies, and identifying labels that signal potential trend changes, momentum shifts, and overbought/oversold conditions. These elements work together to provide a comprehensive visual tool for analyzing market movements and potential trading opportunities.
Why it may be useful
Trading Channel offers traders a versatile and adaptable framework for analyzing price action across different market conditions and timeframes. By providing a visual representation of support and resistance levels, the indicator helps traders identify potential entry and exit points, understand market trends, and develop more informed trading strategies.
The script's flexibility allows users to customize and integrate it with their existing trading approach, making it a valuable tool for both novice and experienced traders. Its ability to generate multiple indicators and signals simultaneously provides a holistic view of market dynamics, enabling more comprehensive market analysis.
When to explore it
The Trading Channel indicator is most effective in markets with clear trending or ranging behavior, particularly in 24/7 markets like cryptocurrency. It works best when used across multiple timeframes, allowing traders to gain insights from higher-level market structures while executing trades on shorter-term charts.
Traders should consider using this indicator when seeking a comprehensive visual tool that combines multiple analytical elements, such as moving averages, pivot points, and trend indicators. It is particularly useful for developing systematic trading approaches, confirming signals from other indicators, and providing a structured framework for making trading decisions.
Keep exploring
What we’ve verified
Access, alerts and repainting behaviour have not been independently verified for this indicator. Check the creator’s current publication and settings.
General descriptions and classifications are recovered research. Verified details above identify the specific checks we have completed. Check the creator’s current publication for later changes.