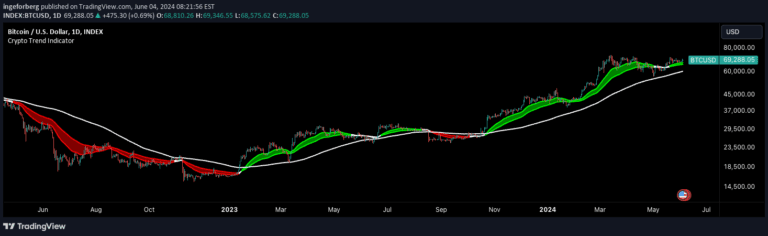
Trend Battery [Phantom] is a dynamic EMA-based indicator that visualizes trend strength through color-coded bars, helping traders quickly assess market momentum and potential trend changes.
Explore complementary indicator rolesHow it works
The Trend Battery [Phantom] analyzes the alignment of 20 Exponential Moving Averages (EMAs) ranging from 8 to 200 periods to calculate trend strength. By assessing how these EMAs are positioned relative to each other, the indicator generates a comprehensive view of market momentum.
The system translates EMA alignment into a color gradient, mapping trend power from bright green (strong uptrend) to deep purple (strong downtrend). As EMAs align more consistently, the bar colors become more saturated, providing traders with an intuitive visual representation of trend dynamics and potential directional shifts.
Why it may be useful
The Trend Battery [Phantom] simplifies complex trend analysis by converting intricate EMA relationships into an easily digestible visual format. By providing an immediate, color-coded snapshot of market momentum, traders can quickly understand underlying trend strength without performing manual calculations.
This visualization helps traders make more informed decisions by offering a holistic view of market movement. The indicator's gradient approach allows for nuanced interpretation, distinguishing between weak and strong trends, and potentially signaling important transitional moments in market sentiment.
When to explore it
The Trend Battery [Phantom] is most effective when used across multiple timeframes to confirm trend direction and strength. On larger timeframes, it can help identify broader market trends for strategic positioning, while on smaller timeframes, it can signal potential entry and exit points.
Traders should be particularly attentive to color transitions and gradient intensity, as these can indicate emerging trend changes or potential reversals. However, it is crucial to combine this indicator with other technical analysis tools and not rely on it as a standalone trading strategy.
Keep exploring
What we’ve verified
Access, alerts and repainting behaviour have not been independently verified for this indicator. Check the creator’s current publication and settings.
General descriptions and classifications are recovered research. Verified details above identify the specific checks we have completed. Check the creator’s current publication for later changes.