
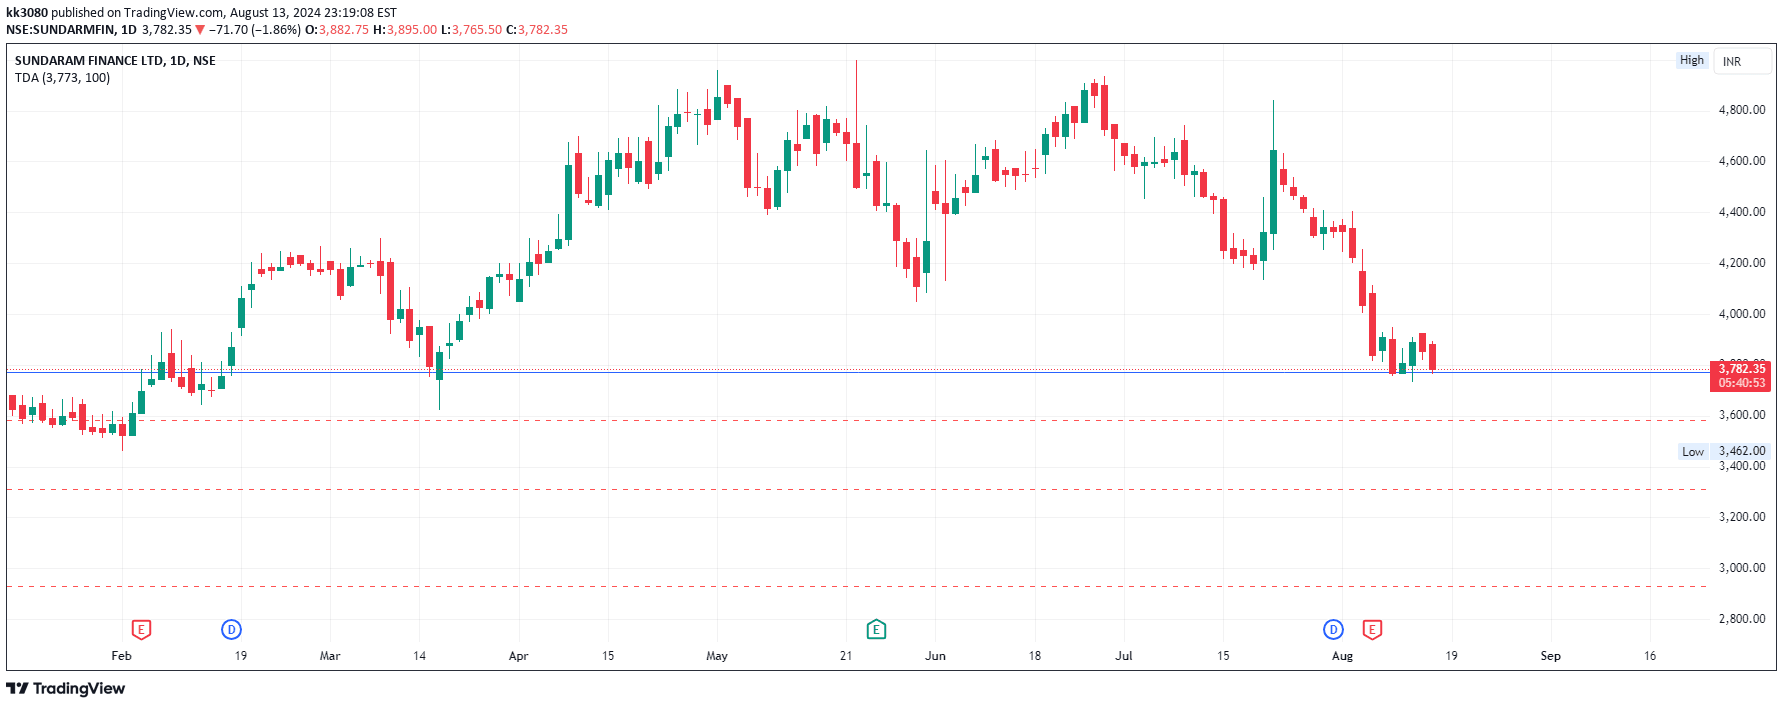
Triple Dip Averaging (TDA) is a strategic investment tool that helps investors systematically reduce their average cost basis by purchasing additional shares at predetermined price drop levels.
Explore complementary indicator rolesHow it works
The Triple Dip Averaging (TDA) indicator operates by establishing three strategic price levels for additional purchases after an initial investment. When the market price falls below the initial buy price, it triggers predetermined averaging opportunities at 5%, 10%, and 15% drop intervals. These levels are automatically calculated based on the investor's initial purchase price and subsequent average prices.
By systematically plotting these levels on a chart, TDA provides visual guidance for potential additional buy points. Each averaging level is designed to help investors lower their overall cost basis by purchasing the same quantity of shares at progressively lower prices during market downturns.
Why it may be useful
The TDA indicator is crucial because it removes emotional decision-making from investment strategies and provides a disciplined approach to managing portfolio costs during market volatility. By offering a structured method for averaging down, investors can potentially reduce their overall investment risk and improve long-term profitability.
The systematic approach helps traders maintain a calm and calculated perspective during market fluctuations. Moreover, the indicator's built-in alert system ensures investors never miss critical pricing opportunities. By providing clear visual cues and predetermined levels for additional purchases, TDA empowers investors to make more informed decisions and maintain a strategic long-term investment perspective.
When to explore it
The Triple Dip Averaging indicator is most effective during periods of market volatility or when an investor identifies a fundamentally strong asset experiencing temporary price declines. It is particularly useful for long-term investors who believe in the underlying value of their investment and are willing to average down their cost basis during short-term market corrections.
The strategy works best with assets that have strong potential for future growth. Investors should consider using TDA when they have confidence in an asset's long-term prospects and are prepared to increase their position during price dips. It is especially beneficial for those who want a systematic approach to managing investments without making impulsive decisions based on short-term market movements.
Keep exploring
What we’ve verified
Access, alerts and repainting behaviour have not been independently verified for this indicator. Check the creator’s current publication and settings.
General descriptions and classifications are recovered research. Verified details above identify the specific checks we have completed. Check the creator’s current publication for later changes.


