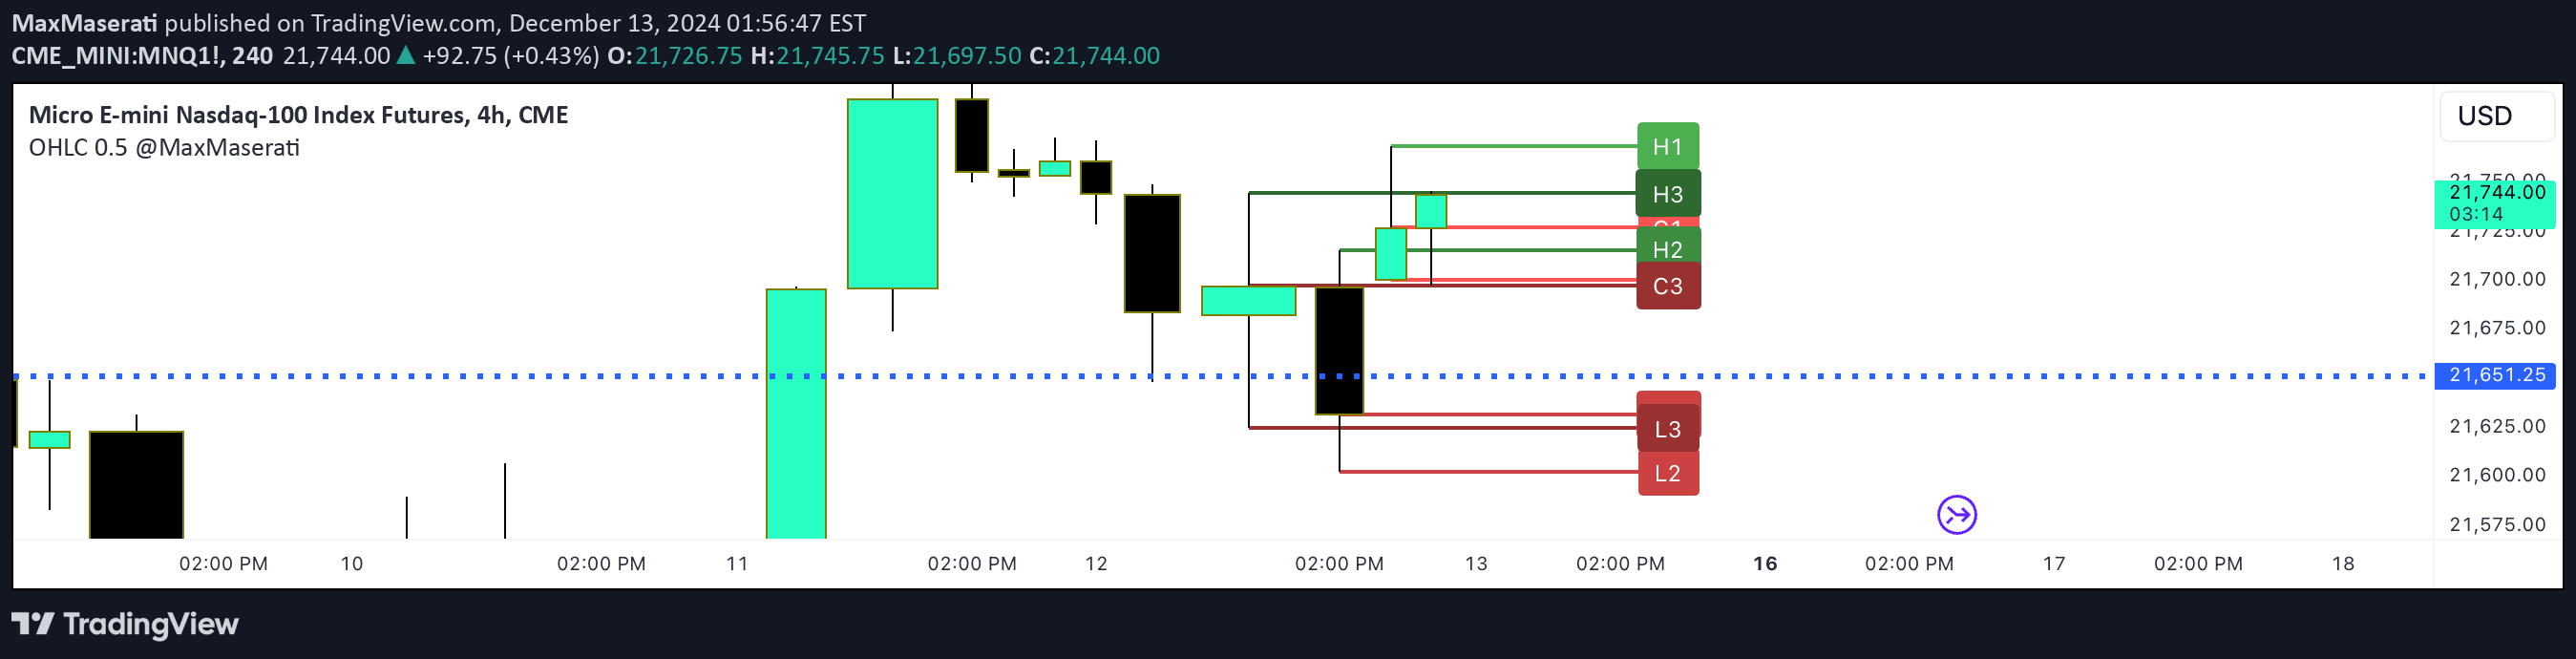
A TradingView Pine script that plots a vertical line on a chart, marking a specific bar with customizable parameters like bar distance and line color.
Explore complementary indicator rolesHow it works
The script allows traders to place a vertical line on a chart at a specified distance from the current candle. Users can customize the number of bars away from the current position and select a specific line color for visual tracking. The script calculates the highest and lowest prices for the specified number of previous bars.
When activated, the script removes any previously drawn line and replaces it with a new vertical line at the designated location. This process ensures that only one line is displayed at a time, providing a clean and focused visual marker on the trading chart.
Why it may be useful
Vertical line markers are crucial for traders who need to visually track specific points of interest on a chart. By allowing customization of line placement and color, traders can quickly highlight important price levels, trend changes, or significant market events. This visual tool helps traders maintain focus and quickly identify key reference points during analysis.
The ability to dynamically update and remove previous lines ensures that the chart remains uncluttered and the most recent marker is always prominent. Such a tool can be particularly useful for tracking patterns, monitoring potential entry or exit points, and maintaining a clear visual narrative of market movements.
When to explore it
This vertical line marker is most effective when traders need to emphasize specific bars or moments in market price action. It can be particularly useful during technical analysis when identifying potential trend reversals, support and resistance levels, or tracking the progression of a specific trading pattern. Traders can use this tool across various timeframes and market conditions.
The script is especially valuable for traders who prefer visual cues and need to quickly mark important chart locations. It can be used in scalping, day trading, and swing trading strategies, providing a flexible tool for marking significant price points or potential trade opportunities across different trading styles and market instruments.
Keep exploring
What we’ve verified
Access, alerts and repainting behaviour have not been independently verified for this indicator. Check the creator’s current publication and settings.
General descriptions and classifications are recovered research. Verified details above identify the specific checks we have completed. Check the creator’s current publication for later changes.