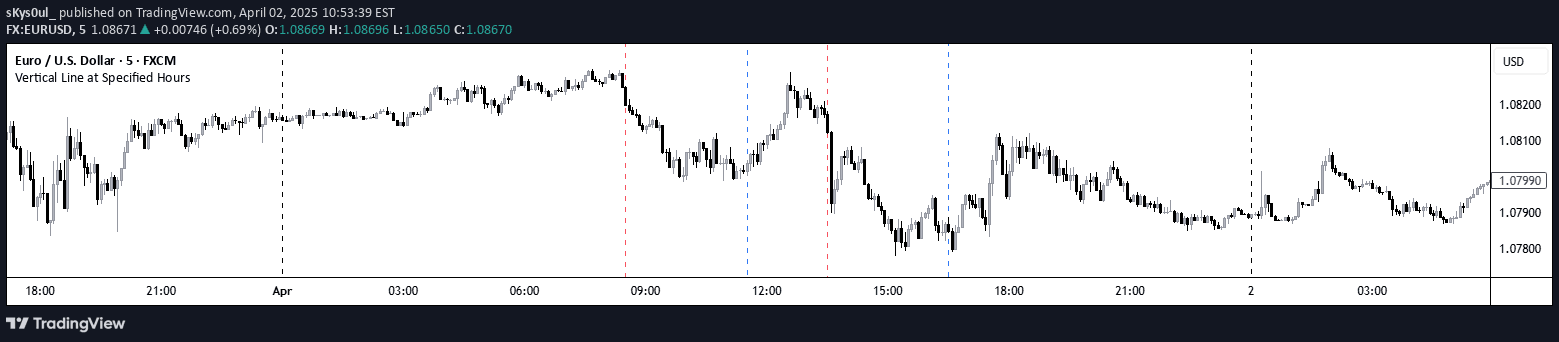
A versatile trading tool that allows traders to draw vertical lines on charts to mark and separate different trading sessions or time periods with customizable settings.
Explore complementary indicator rolesHow it works
This indicator enables traders to draw multiple vertical lines simultaneously on a trading chart to visually separate different time periods or trading sessions. Users can customize the lines by selecting up to 10 distinct vertical lines with unique colors and line styles.
The lines are drawn directly on the chart, providing a clear visual demarcation of specific time segments. Traders can input precise times in the New York time zone to mark important market transitions or session boundaries. The lines help create visual boundaries that enhance chart readability and temporal organization
Why it may be useful
Vertical line indicators are crucial for traders who need to segment and analyze market data across different time periods. They provide a quick visual reference for key market transitions, session changes, and important temporal landmarks.
By clearly marking specific time intervals, traders can more easily identify patterns, compare market behavior, and track performance across different sessions. The ability to customize line colors and styles allows for personalized chart annotation that matches individual trading strategies and visual preferences
When to explore it
This indicator is most effective when traders want to distinguish between different market sessions, such as Asian, European, and US trading hours. It is particularly useful for analyzing intraday price movements, tracking specific trading windows, and comparing market performance across different time segments.
Traders can use it during volatile market periods to mark significant news events, earnings releases, or economic announcements. The tool is especially valuable for day traders and swing traders who need to segment and analyze market behavior within specific time frames
Keep exploring
What we’ve verified
Access, alerts and repainting behaviour have not been independently verified for this indicator. Check the creator’s current publication and settings.
General descriptions and classifications are recovered research. Verified details above identify the specific checks we have completed. Check the creator’s current publication for later changes.