
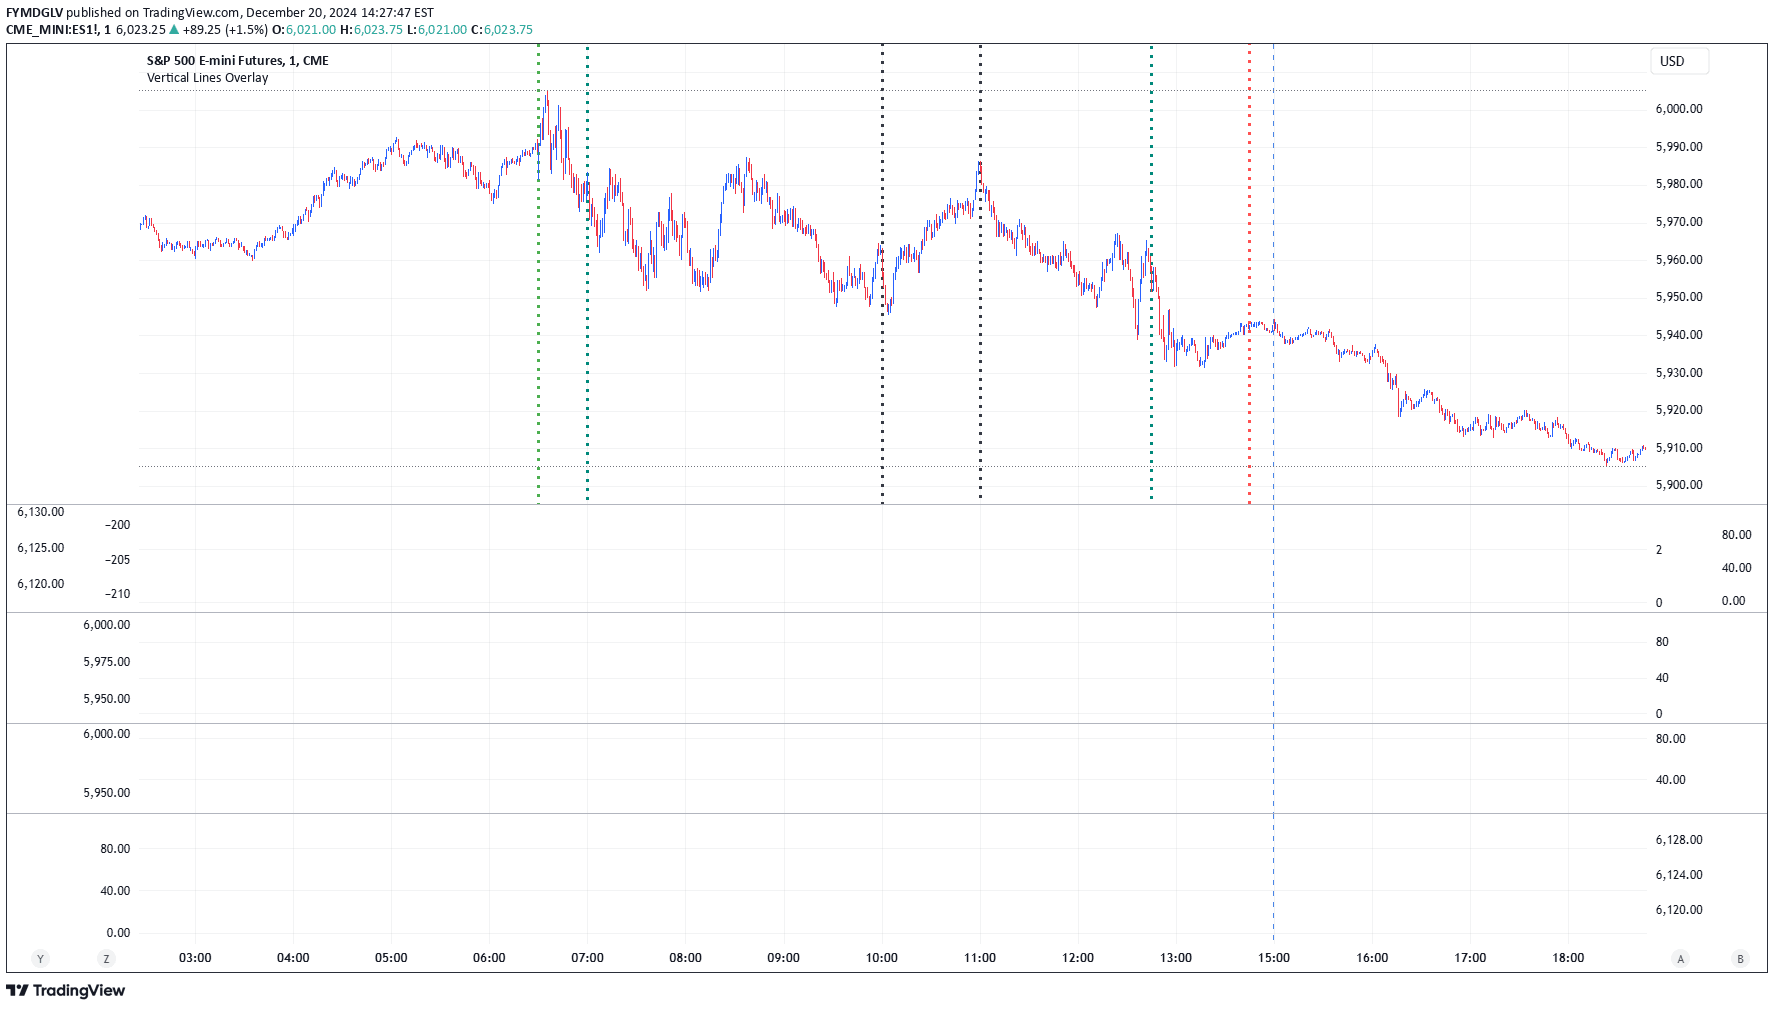
A customizable tool for plotting vertical lines on charts at specific times, allowing traders to mark key events, session changes, and time-based market analysis with precision.
Explore complementary indicator rolesHow it works
The vertical lines overlay works by allowing traders to input up to six distinct times of the day where lines will automatically be drawn on the chart. Users can customize each line's style, width, and color through a settings panel, providing flexibility in visual presentation and analysis.
The script uses predefined time inputs and optional time offsets to ensure the lines are accurately positioned across different trading instruments and time zones. By enabling or disabling specific lines and adjusting their parameters, traders can create a personalized visual framework for tracking important market moments.
Why it may be useful
Vertical lines provide a critical visual reference for traders, helping them quickly identify and remember significant market events, session transitions, and strategic time-based insights. By marking specific times with customizable lines, traders can enhance their chart analysis and maintain a clear view of important temporal markers.
This tool transforms abstract time-based information into tangible visual cues, allowing traders to improve their market awareness and decision-making process. The ability to personalize line attributes ensures that each trader can develop a unique visual language that suits their individual trading strategy and analytical approach.
When to explore it
These vertical lines are most effective during active trading sessions where timing plays a crucial role, such as during market opens, expected news releases, or known volatility periods. Traders can use these lines to mark potential entry and exit points, track specific market sessions, or highlight anticipated price movement windows.
The overlay is particularly useful for day traders and scalpers who rely heavily on precise timing and short-term market dynamics. By providing a clear, customizable visual tool, traders can quickly reference important time-based information without cluttering their primary price analysis.
Keep exploring
What we’ve verified
Access, alerts and repainting behaviour have not been independently verified for this indicator. Check the creator’s current publication and settings.
General descriptions and classifications are recovered research. Verified details above identify the specific checks we have completed. Check the creator’s current publication for later changes.


