
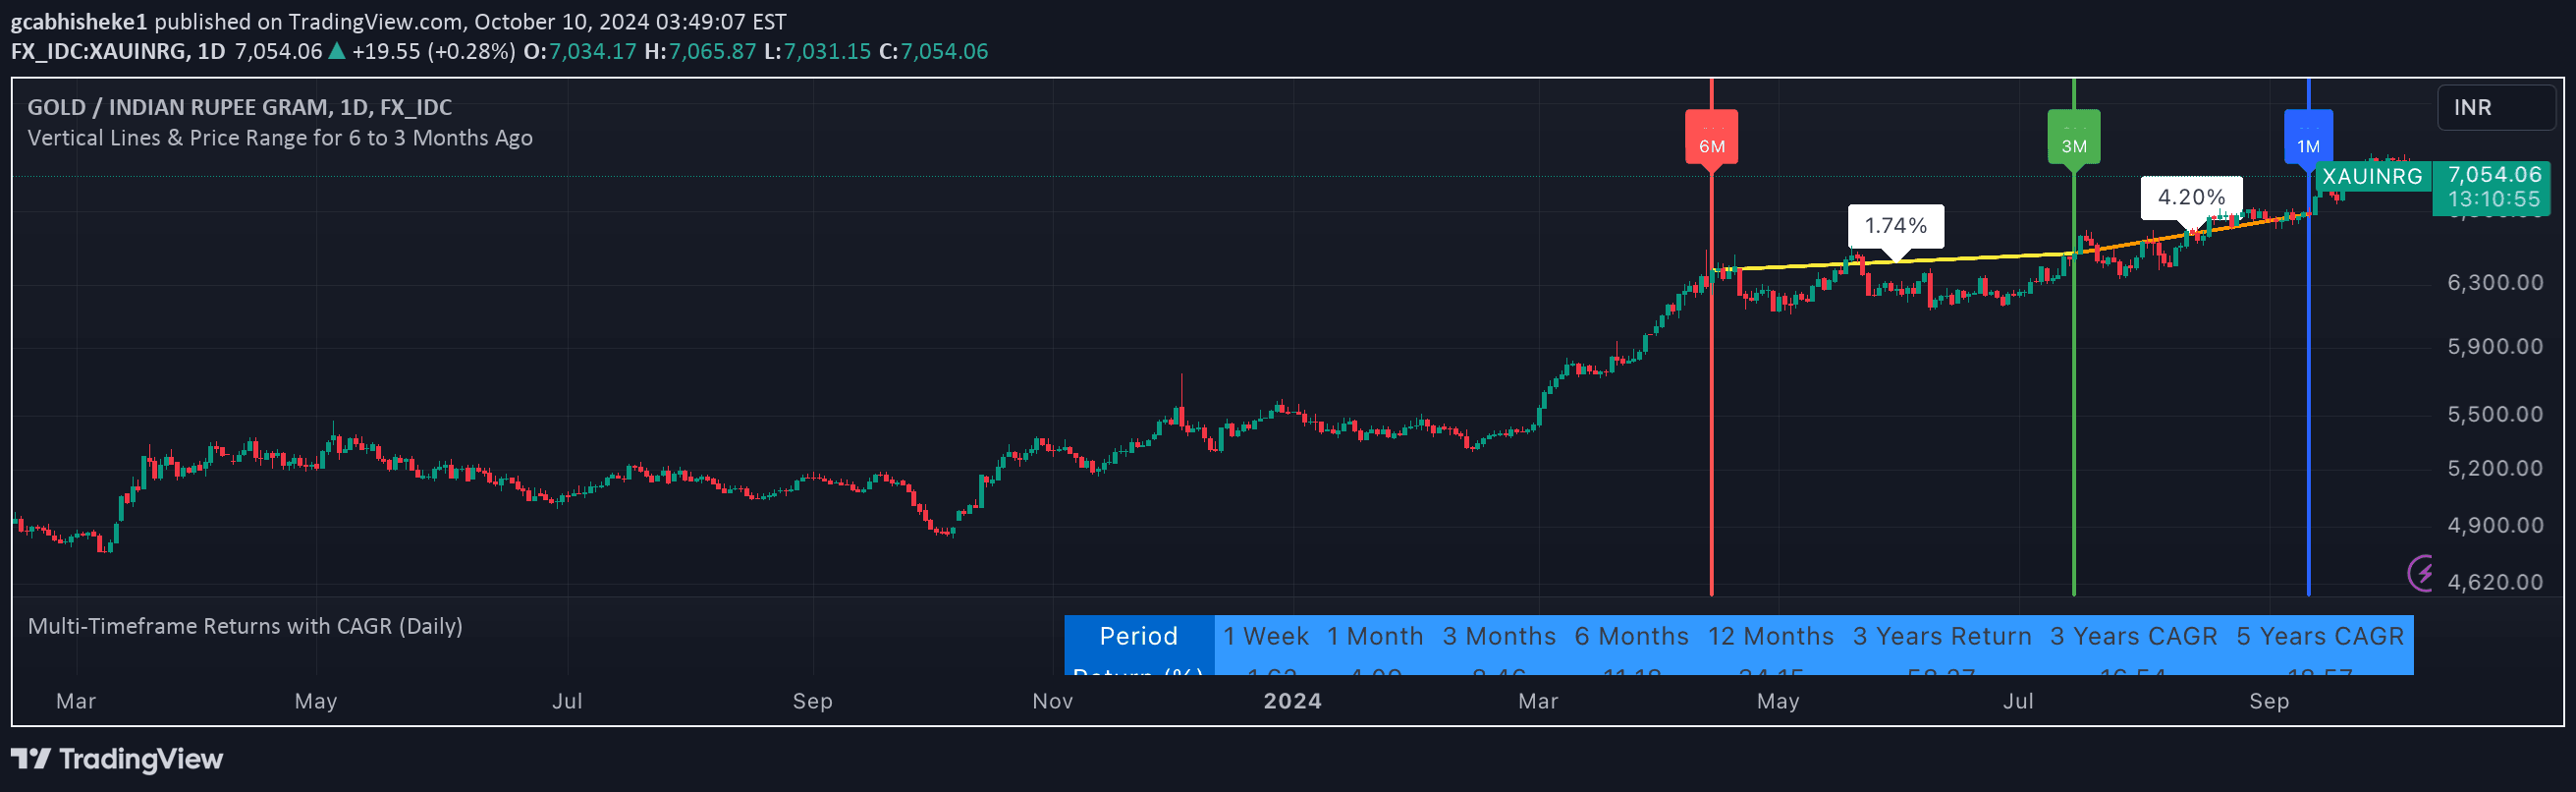
A visual tool tracking historical price points by marking vertical lines at 6, 3, and 1 month intervals, calculating percentage changes and displaying trend performance.
Explore complementary indicator rolesHow it works
The indicator automatically identifies and marks specific historical time intervals on the price chart, creating vertical lines at 6, 3, and 1 month ago. These lines serve as visual reference points for tracking price movements and historical performance over time.
By calculating the percentage changes between these predefined periods, the tool generates horizontal lines connecting the closing prices, which help traders quickly understand the magnitude and direction of price shifts across different timeframes.
Why it may be useful
This signal provides traders with a comprehensive visual representation of historical price trends, enabling quick and intuitive analysis of market movements over extended periods. By offering clear markers and percentage change calculations, it helps traders rapidly assess how prices have evolved across different time intervals.
The visual approach allows traders to quickly identify potential trend strengths, weaknesses, and directional shifts without complex mathematical calculations, making trend analysis more accessible and immediate.
When to explore it
The indicator is most effective for swing traders and investors looking to analyze medium to long-term price trends and historical performance. It works particularly well when examining markets with clear directional movements and those experiencing significant seasonal or cyclical variations.
Traders can utilize this tool when conducting technical analysis, portfolio review, or when seeking to understand broader market trends beyond short-term price fluctuations. It is especially useful for comparing price performance across different recent time periods.
Keep exploring
What we’ve verified
Access, alerts and repainting behaviour have not been independently verified for this indicator. Check the creator’s current publication and settings.
General descriptions and classifications are recovered research. Verified details above identify the specific checks we have completed. Check the creator’s current publication for later changes.


