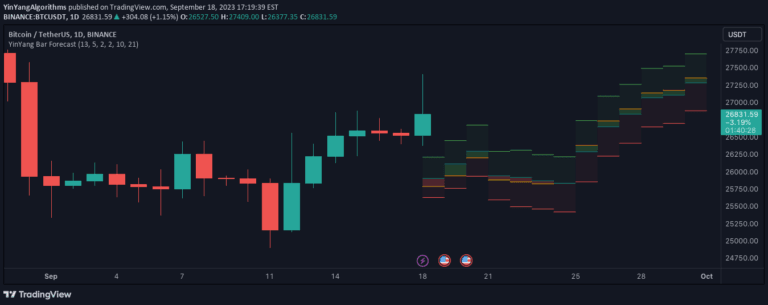
A predictive indicator that forecasts price movement on the next candle by analyzing price highs and lows from the previous five candles using linear regression.
Explore complementary indicator rolesHow it works
The indicator operates by collecting the price highs and lows from the previous five candles and calculating their average values. It then constructs a linear regression line based on these five averaged values to predict the potential price movement for the upcoming sixth candle.
When the linear regression line shows an upward trajectory, the indicator generates a green circle, signaling a potential price increase. Conversely, when the regression line indicates a downward trend, a red circle appears, suggesting a potential price decline.
Why it may be useful
This indicator provides traders with a quick visual representation of potential price movements, offering immediate insights into short-term market trends. By simplifying complex price action analysis into color-coded signals, it helps traders make faster and more intuitive trading decisions.
The linear regression approach allows traders to understand underlying price momentum without requiring extensive technical analysis skills. Its straightforward green and red circle system makes it accessible to both novice and experienced traders seeking rapid market trend assessments.
When to explore it
The indicator is most effective in markets with clear short-term trends and relatively stable price movements. It works best in timeframes ranging from minutes to hours, making it particularly suitable for scalping and day trading strategies. Traders should use it in conjunction with other technical analysis tools to confirm signals.
This indicator is particularly useful in volatile markets where quick trend identification can provide a competitive edge. However, traders should be cautious and not rely solely on this signal, as market conditions can change rapidly and unexpected events can quickly invalidate short-term predictions.
Keep exploring
What we’ve verified
Access, alerts and repainting behaviour have not been independently verified for this indicator. Check the creator’s current publication and settings.
General descriptions and classifications are recovered research. Verified details above identify the specific checks we have completed. Check the creator’s current publication for later changes.