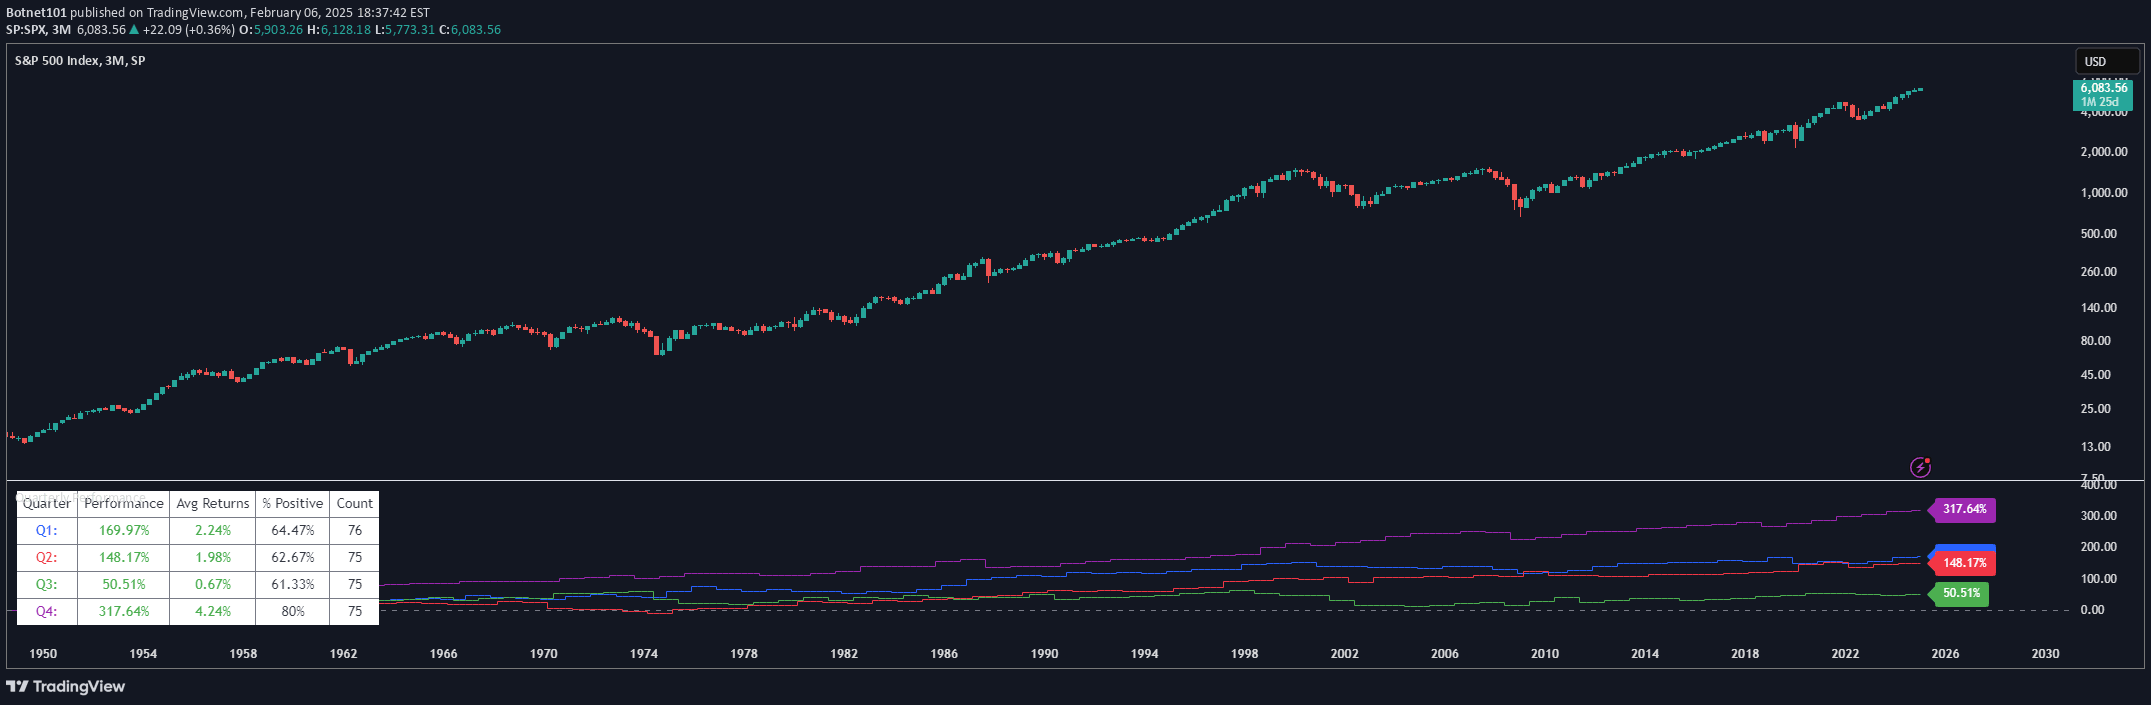
A Pine Script indicator that calculates and displays annual performance metrics, providing traders with comprehensive yearly return analysis using arithmetic and geometric mean calculations.
Explore complementary indicator rolesHow it works
The indicator automatically identifies the first trading day of each calendar year and calculates percentage returns based on closing prices from the first to the last trading day. It generates two primary performance metrics: the arithmetic mean, which provides a simple average of annual returns, and the geometric mean (CAGR), which accounts for compounding effects.
The calculation process focuses exclusively on daily timeframes, tracking returns across a configurable period of 1-50 years. By presenting both arithmetic and geometric averages, the indicator offers traders a comprehensive view of historical performance, highlighting potential trends and growth patterns.
Why it may be useful
Understanding annual performance metrics is crucial for evaluating long-term investment strategies and assessing the consistency of returns across different market conditions. The arithmetic mean provides a straightforward snapshot of average returns, while the geometric mean offers a more nuanced perspective by incorporating the compounding effect.
By presenting these metrics side by side, traders can make more informed decisions about asset performance, identify potential seasonal trends, and develop more robust investment approaches that account for both variability and sustained growth potential.
When to explore it
This indicator is most valuable for investors and traders interested in comprehensive long-term performance analysis, particularly those focused on swing trading and strategic asset allocation. It is especially useful when evaluating investments with multi-year horizons, where understanding consistent growth patterns becomes critical.
The tool is most effective when applied to assets with substantial historical data, allowing for meaningful year-by-year comparisons. Traders should use this indicator as a complementary analysis tool, combining its insights with other technical and fundamental research to develop well-rounded investment strategies.
Keep exploring
What we’ve verified
Access, alerts and repainting behaviour have not been independently verified for this indicator. Check the creator’s current publication and settings.
General descriptions and classifications are recovered research. Verified details above identify the specific checks we have completed. Check the creator’s current publication for later changes.