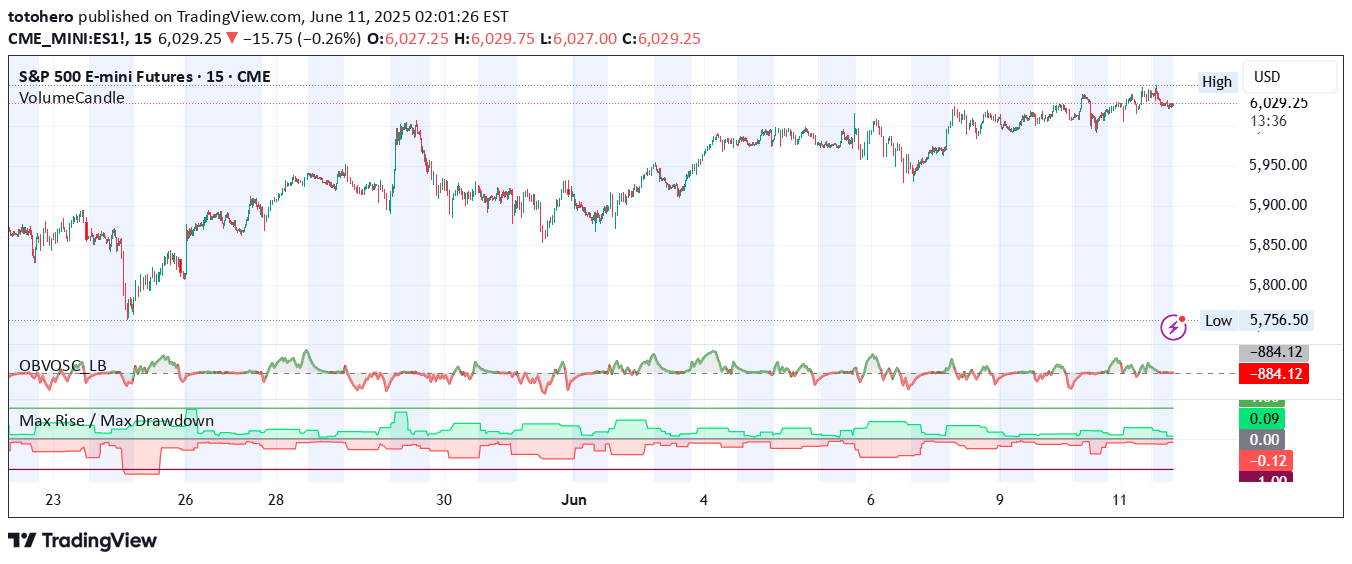
A trading signal that provides visual performance tracking by displaying Year-to-Date percentage gain/loss and maximum drawdown percentage from the all-time high market point.
Explore complementary indicator rolesHow it works
The signal calculates the Year-to-Date (YTD) percentage performance by comparing the current price to the price at the beginning of the calendar year. It tracks the cumulative gains or losses since January 1st, providing traders with a snapshot of overall market performance. This metric helps quantify the total return an investment has generated in the current year.
The drawdown percentage from the All-Time High (ATH) is determined by measuring the maximum decline from the highest historical price point. By displaying this metric, traders can understand the potential loss from the peak value and assess the investment's current performance relative to its historical maximum.
Why it may be useful
YTD performance provides traders with a comprehensive view of investment performance over the current calendar year, allowing quick assessment of overall market trends and portfolio health. This metric helps investors evaluate the effectiveness of their trading strategies and compare returns across different investment vehicles or market sectors.
Drawdown percentage offers critical risk management insights by revealing the maximum potential loss from peak values. It helps traders understand historical volatility, assess potential downside risks, and make informed decisions about portfolio allocation and risk tolerance.
When to explore it
Traders should utilize YTD performance tracking during periodic portfolio reviews, investment strategy assessments, and when comparing different financial instruments or market sectors. This metric is particularly useful at quarter-end or mid-year points to evaluate investment performance and make strategic adjustments.
Drawdown percentage analysis is most valuable when assessing long-term investment risk, selecting investment vehicles, and understanding market volatility. Investors can use this metric during market turbulence, when evaluating new investment opportunities, or when developing comprehensive risk management strategies.
Keep exploring
What we’ve verified
Access, alerts and repainting behaviour have not been independently verified for this indicator. Check the creator’s current publication and settings.
General descriptions and classifications are recovered research. Verified details above identify the specific checks we have completed. Check the creator’s current publication for later changes.