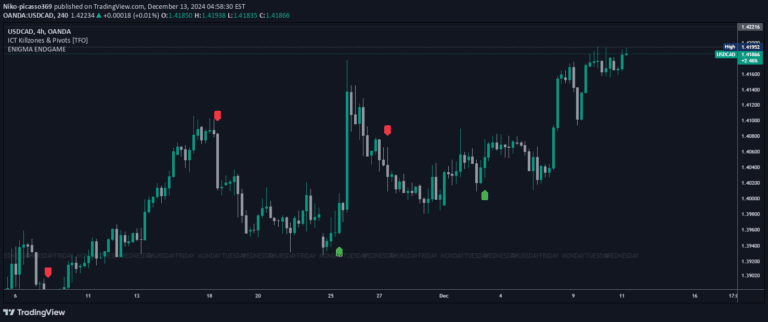
Enigma Endgame with Dynamic Trend-Based Fibonacci
A trading script combining dynamic Fibonacci levels with fractal support and resistance analysis to identify market momentum and potential entry points across multiple timeframes.
Explore 11,183 indicators. Filter beyond the obvious.
Discover the tools that fit the way you trade.
11,183 tools to explore
A trading script combining dynamic Fibonacci levels with fractal support and resistance analysis to identify market momentum and potential entry points across multiple timeframes.
A dynamic support and resistance indicator that identifies potential market reversals by analyzing individual candle highs and lows and providing strategic entry points across different timeframes.
A technical chart pattern indicator that identifies diamond formations, signaling potential trend reversals and providing traders with insights into possible price direction changes.
EBL is an advanced market structure tracking script that identifies key price breaks and potential trend shifts using dynamic horizontal lines and directional arrows.
A custom forex trading indicator that identifies high-probability entry points by hunting liquidity zones during London and US trading sessions using candle momentum and optional trend filtering.
DB369 is a multi-timeframe trend indicator that identifies market direction by analyzing pivot points across different timeframes and generating buy/sell signals when trends align.
An advanced indicator generating precise buy and sell signals by analyzing candlestick patterns during key market session transitions, focusing on optimal trading opportunities.
A multi-timeframe trading indicator that combines Fibonacci retracements with higher and lower timeframe price action to generate precise buy and sell signals with dynamic visual insights.
A multi-timeframe market bias indicator that tracks price movements, calculates market direction, and evaluates trade performance across different timeframes.
The Speed of Change indicator measures the rate of price movement, helping traders understand momentum and potential trend acceleration or deceleration in financial markets.
A multi-timeframe trading indicator that identifies key price levels, detects Break of Structure (BOS), and generates trade signals based on level retests across different timeframes.
An advanced trading indicator that identifies bullish and bearish engulfing patterns using Smart Money Concepts and Fibonacci levels to highlight potential market reversals and entry points.
Likes, views, and comments are historical TradingView snapshots. They describe attention, not trading performance.