FluidTrades - SMC Lite
A trading indicator that uses pivot points to identify supply and demand zones, market structure, and potential trading opportunities through visual analysis of price action.
Explore 11,183 indicators. Filter beyond the obvious.
Discover the tools that fit the way you trade.
11,183 tools to explore
A trading indicator that uses pivot points to identify supply and demand zones, market structure, and potential trading opportunities through visual analysis of price action.
A comprehensive market sentiment indicator that synthesizes multiple technical analysis techniques into a single value, providing insights into market direction, momentum, and potential trend reversals.
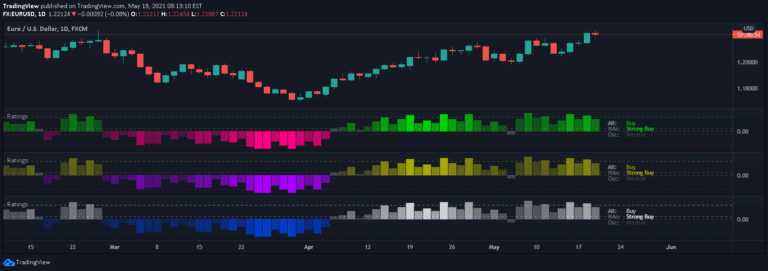
A comprehensive trading signal that aggregates 26 technical indicators into a single rating, evaluating market sentiment through moving averages and oscillators to provide actionable trading insights.
Zero Lag Trend Signals is an advanced indicator that eliminates trend detection delays by using zero-lag EMA and volatility bands across multiple timeframes.
A dynamic trading panel displaying multiple technical indicators in a color-coded table format, allowing traders to quickly assess market conditions across multiple symbols simultaneously.
Gaussian Process Regression (GPR) is a machine learning method for forecasting price trends by analyzing recent price observations and estimating underlying market movements.
A sophisticated trading signal that combines trend detection, price rejection logic, and dynamic ATR-based target projection to identify and validate potential trend continuation opportunities.
A dynamic trend analysis tool using Hull-EMA curves that color-codes price bars, plots support/resistance boxes, and identifies high-probability breakout retests for traders.
A trading indicator that identifies market structure shifts and breakout opportunities using smart money concepts like Break of Structure and Change of Character.
A trading indicator that identifies liquidity sweeps and major liquidation events, helping traders anticipate market reversals and structure shifts through advanced volume and trend analysis.
An advanced trading tool identifying market reversals and breakouts using dynamic period settings, volume analysis, and visual indicators to help traders recognize potential entry and exit points.
A dynamic trading indicator that automatically identifies supply and demand zones, helping traders detect potential price reversal areas by analyzing market volume and pivot points.
Likes, views, and comments are historical TradingView snapshots. They describe attention, not trading performance.