Williams Percent Range with Trendlines and Breakouts
Williams Percent Range indicator with trendlines to identify market trends, overbought/oversold conditions, and potential breakouts across different trading timeframes.
Explore 11,183 indicators. Filter beyond the obvious.
Discover the tools that fit the way you trade.
11,183 tools to explore
Williams Percent Range indicator with trendlines to identify market trends, overbought/oversold conditions, and potential breakouts across different trading timeframes.
An indicator that calculates the gas-equivalent price based on oil prices, helping traders analyze the relative value between oil and natural gas commodities.
A spread analysis tool that measures the relationship between natural gas and oil prices, identifying potential market mispricings and mean-reversion opportunities in energy commodities.
A customizable opening range indicator for commodities trading that identifies high and low price levels during a specified time window, helping traders spot potential breakouts and trading opportunities.
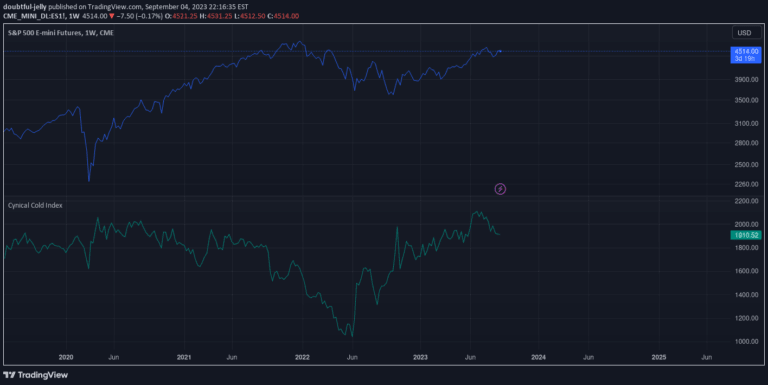
The Cynical Cold Index tracks economic conditions by calculating a weighted basket of commodity prices across 13 different commodities, providing insights into market sentiment and potential economic trends.
Likes, views, and comments are historical TradingView snapshots. They describe attention, not trading performance.