Engulfing and Doji Scanner with SL
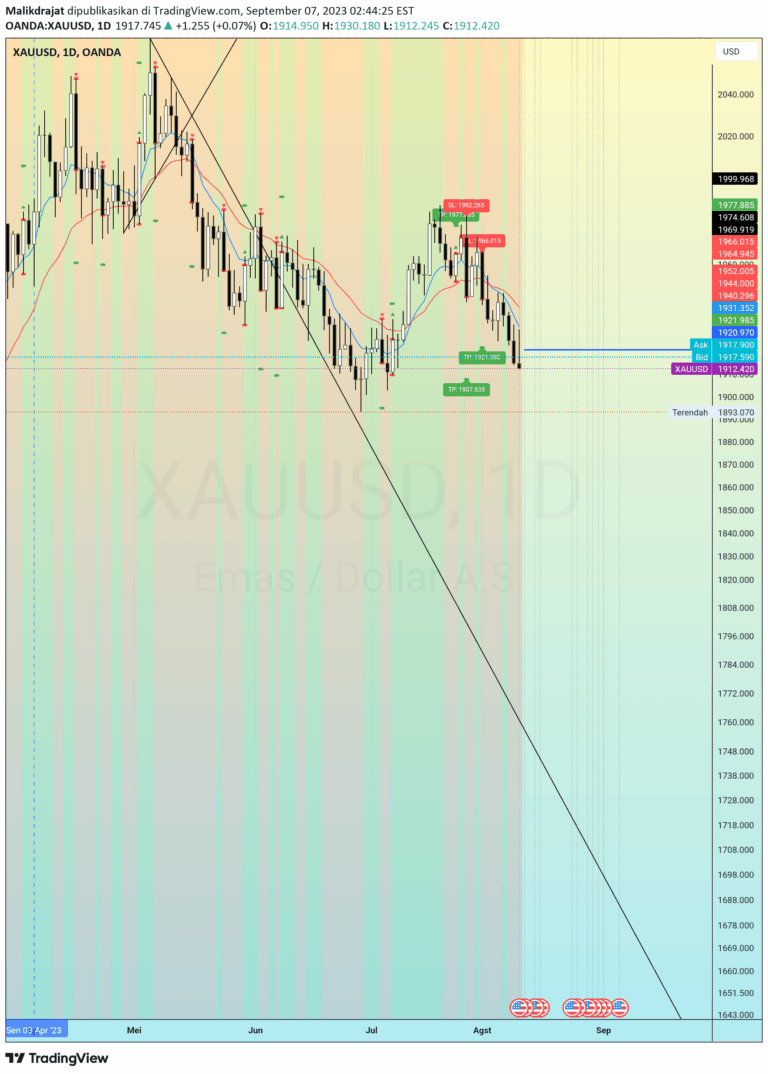
A trading signal that identifies bullish and bearish engulfing patterns and doji formations to help traders recognize potential market reversals and entry points.
Explore 11,183 indicators. Filter beyond the obvious.
Discover the tools that fit the way you trade.
11,183 tools to explore
A trading signal that identifies bullish and bearish engulfing patterns and doji formations to help traders recognize potential market reversals and entry points.
A trading strategy using the first candlestick of the market session to identify potential buy or sell signals based on price breakouts from the initial 9:30 AM candle's high and low.
A trading script that identifies Engulfing Candlestick and Inside Bar patterns while plotting Exponential Moving Averages to help traders recognize potential market trends and entry points.
A comprehensive Nifty dashboard tracking multiple stock and futures metrics, providing detailed insights into price, volume, open interest, and market dynamics.
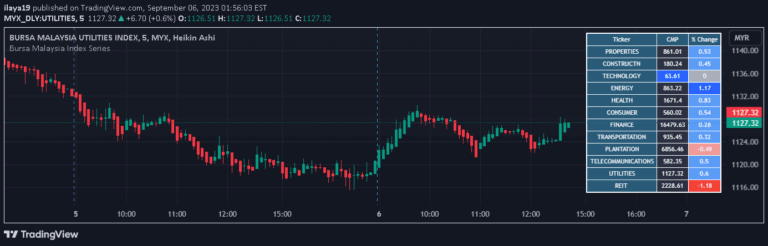
Bursa Malaysia Index Series tracks market capitalization, providing a real-time representation of the Malaysian stock market's performance through periodic 60-second computational updates.
A NIFTY Futures indicator tracking real-time price deviation from Volume-Weighted Average Price, offering insights into market trend and potential reversal points.
Likes, views, and comments are historical TradingView snapshots. They describe attention, not trading performance.