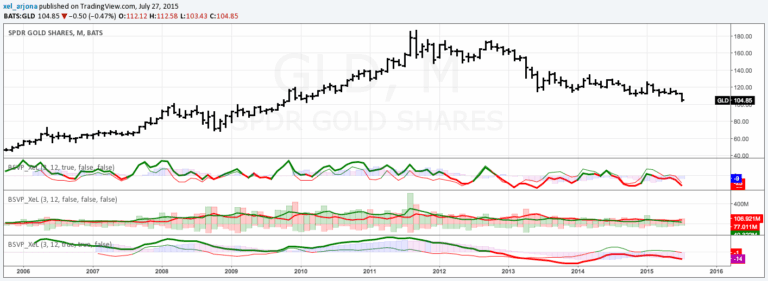
CM MACD Custom Indicator - Multiple Time Frame - V2
CM MACD Ultimate Multi-Timeframe V2 is an advanced MACD indicator with enhanced customization options, multi-timeframe analysis, and comprehensive trend visualization features.
Explore 11,183 indicators. Filter beyond the obvious.
Discover the tools that fit the way you trade.
11,183 tools to explore
CM MACD Ultimate Multi-Timeframe V2 is an advanced MACD indicator with enhanced customization options, multi-timeframe analysis, and comprehensive trend visualization features.
An advanced algorithmic indicator that automatically identifies and classifies complex chart patterns by analyzing trend lines, pivot points, and geometric formations across multiple timeframes.
A custom ZigZag indicator that identifies market reversals using momentum indicators, providing true pivot points without repainting and highlighting impulse strength.
A trading signal that analyzes price action in relation to volume pressure, providing insights into market trends through volume-based histograms and buy-sell convergence/divergence indicators.
A comprehensive trading indicator combining Parabolic SAR, EMA 200, and MACD to generate precise buy and sell signals by analyzing market trends and momentum.
An adaptive MACD oscillator that dynamically adjusts to market conditions, filtering noise and capturing trend variations by interpolating between different filter coefficients.
An advanced MACD variant that normalizes momentum measurements and uses Heikin-Ashi candles to provide smoother trend analysis across different assets and timeframes.
A technical analysis tool combining MACD and RSI overlaid on price charts, offering traders insights into market momentum, trend direction, and potential trade signals.
MACD is a trend-following momentum indicator that reveals changes in price strength, direction, and duration by comparing two moving averages and their relationship.
A multi-timeframe Fair Value Gap (FVG) indicator that identifies potential price reaction zones by analyzing overlapping price gaps across different chart periods.
A technical analysis method identifying divergences between price action and indicators to predict potential trend reversals or continuations in stock trading.
Regular Divergence is a technical analysis method that identifies potential trend reversals by comparing price movements with oscillator indicator patterns, revealing hidden market dynamics.
Likes, views, and comments are historical TradingView snapshots. They describe attention, not trading performance.