Ichimoku Kinkō hyō 目均衡表
An advanced Ichimoku Kinko Hyo indicator with extensive customization options for analyzing market trends, momentum, and potential trading signals across different timeframes.
Explore 11,183 indicators. Filter beyond the obvious.
Discover the tools that fit the way you trade.
11,183 tools to explore
An advanced Ichimoku Kinko Hyo indicator with extensive customization options for analyzing market trends, momentum, and potential trading signals across different timeframes.
Parabolic RSI combines Parabolic SAR with Relative Strength Index to identify momentum shifts and potential trend reversals using a unique diamond-based signal system.
A two-pole filter trend indicator that smooths price data, uses gradient colors to show trend strength, and plots dynamic support/resistance dots to help traders identify market trends and potential reversals.
A trading tool that tracks major economic events and their potential market impact, helping traders understand pivotal moments in financial markets.
A market structure analysis tool that combines swing point detection with volatility bands to identify trend shifts, breakouts, and potential reversal points in price action.
An AI-powered SuperTrend clustering oscillator that identifies market trends by analyzing multiple SuperTrend indicators through k-means clustering, providing bullish, bearish, and consensus outputs.
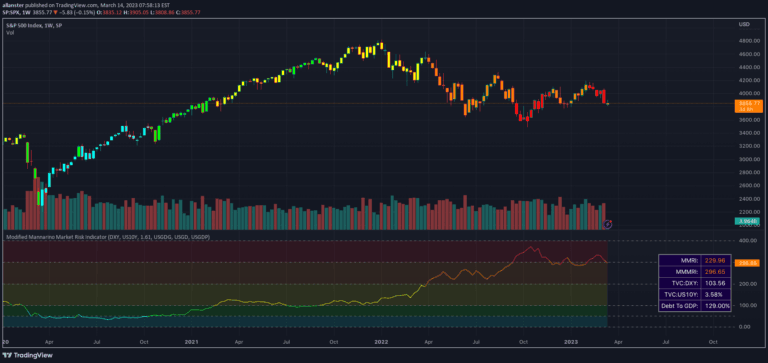
The Modified Mannarino Market Risk Indicator (MMMRI) evaluates market risk by analyzing debt, USD strength, and interest rates to provide a comprehensive risk assessment tool for traders.
A versatile moving average oscillator that uses multiple MA types to analyze market trends, calculating Z-Score to identify potential reversals and market conditions.
ABCD Projection Indicator identifies and projects ABCD chart patterns using a Zigzag-based approach, helping traders spot potential trend continuation opportunities in financial markets.
Comprehensive chart pattern detection indicator that automatically identifies and alerts traders to 25+ different chart pattern formations across multiple market conditions and timeframes.
A comprehensive SuperTrend indicator that integrates volume dynamics, trend detection, and multi-asset trend analysis with automated support/resistance level management.
A multi-dimensional trading signal that identifies potential trend reversals and continuations using engulfing candle patterns, band lines, and color-coded visual indicators.
Likes, views, and comments are historical TradingView snapshots. They describe attention, not trading performance.