YOUR INDICATOR RESEARCH STARTS HERE

Find the right indicator.
Understand what it does.

Explore 11,183 indicators. Filter beyond the obvious.
Discover the tools that fit the way you trade.

THE INDICATOR LIBRARY

Results for “minute”

11,183 tools to explore

852 indicators matching your filters
Save search
TrendMomentum

Fair Value Gap [LuxAlgo]

by LuxAlgo

Fair Value Gaps (FVG) identify market imbalances between buyers and sellers, highlighting potential support and resistance levels where price movements might reverse or continue.

Main price chart · unverifiedDay Trading · Swing Trading
Explore
10.3Klikes320.4Kviews61comments
Save
LevelsSignalTrend

ICT Silver Bullet [LuxAlgo]

by LuxAlgo

An advanced trading indicator that identifies potential Fair Value Gaps during specific one-hour market sessions and highlights support/resistance levels for strategic entry and exit points.

Main price chart · unverifiedScalping · Day Trading
Explore
10.1Klikes354.3Kviews125comments
Save
VolumeSignal

Volume Delta Candles [LuxAlgo]

by LuxAlgo

Volume Delta Candles analyze intrabar trading activity by comparing buy and sell volumes, providing visual insights into price movement and trading sentiment within each candle.

Main price chart · unverifiedScalping · Day Trading
Explore
8.8Klikes229.5Kviews53comments
Save
TrendVolatilityEditor’s pick

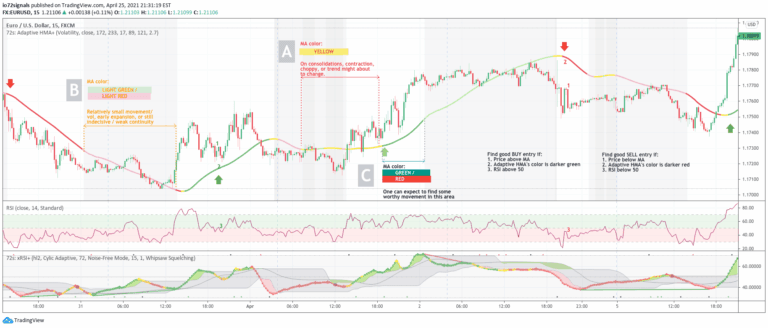
72s: Adaptive Hull Moving Average+

by io72signals

An adaptive Hull Moving Average that dynamically adjusts its period based on volume and volatility, providing clearer trend signals and market condition insights for traders.

Main price chart · unverifiedDay Trading · Swing Trading
Explore
8.2Klikes154.6Kviews137comments
Save
LevelsSignal

Liquidity Sweeps [LuxAlgo]

by LuxAlgo

A trading indicator that detects liquidity sweeps by identifying price breaks through key liquidity levels, highlighting potential support/resistance zones and entry opportunities.

Main price chart · unverifiedScalping · Day Trading
Explore
8Klikes224.1Kviews25comments
Save
SignalVolatilityVolume

Smart Money Breakouts [ChartPrime]

by ChartPrime

A dynamic breakout trading indicator that identifies market movements through change in character and break of structure patterns, with integrated volume analysis and customizable take profit levels.

Separate pane · unverifiedScalping · Day Trading
Explore
7.1Klikes238.1Kviews86comments
Save
LevelsSignalTrend

ICT Turtle Soup | Flux Charts

by fluxchart

An advanced trading indicator implementing the ICT Turtle Soup strategy, which identifies liquidity zones and market structure shifts to generate precise entry and exit signals for traders.

Main price chart · unverifiedScalping · Day Trading
Explore
6Klikes127.1Kviews34comments
Save
SignalTrend

ORB Algo | Flux Charts

by fluxchart

An advanced Opening Range Breakout (ORB) indicator that analyzes market trends in the first session minutes, providing precise entry, take-profit, and stop-loss signals.

Main price chart · unverifiedScalping · Day Trading
Explore
5.5Klikes146.3Kviews87comments
Save
VolumeTrendEditor’s pick

Waindrops [Makit0]

by makit0

A custom volume profile indicator that visualizes trading volume across custom time periods, splitting each period into halves and displaying volume and sentiment through color-coded histograms.

Separate pane · unverifiedDay Trading · Swing Trading
Explore
5.3Klikes75Kviews107comments
Save
LevelsSignal

ICT Macros [LuxAlgo]

by LuxAlgo

An advanced trading indicator that identifies specific market timing intervals where algorithmic trading creates or interacts with liquidity at predetermined times.

Main price chart · unverifiedScalping · Day Trading
Explore
4.9Klikes142Kviews68comments
Save
SignalTrendVolatility

Twin Range Filter Visualized

by KivancOzbilgic

Twin Range Filter is an advanced trend indicator that creates dynamic upper and lower ranges using exponential moving averages to generate buy and sell signals based on price crossovers.

Main price chart · unverifiedScalping · Day Trading
Explore
4.7Klikes78.1Kviews22comments
Save

Likes, views, and comments are historical TradingView snapshots. They describe attention, not trading performance.

START WITH A QUESTION

A little less searching.
A lot more understanding.

Tell DeepAlpha what you need. Get an explanation, a shortlist,
and a direct path to the indicators behind it.

Ask DeepAlpha