Liquidity Sweeps [LuxAlgo]
A trading indicator that detects liquidity sweeps by identifying price breaks through key liquidity levels, highlighting potential support/resistance zones and entry opportunities.
Explore 11,183 indicators. Filter beyond the obvious.
Discover the tools that fit the way you trade.
11,183 tools to explore
A trading indicator that detects liquidity sweeps by identifying price breaks through key liquidity levels, highlighting potential support/resistance zones and entry opportunities.
A real-time trading profile indicator that visualizes volume, price, time, activity, and age across different market levels, providing dynamic insights into trading activity.
A real-time volume delta and tick indicator providing detailed insights into market dynamics by analyzing live trading updates, focusing on price action and volume information at small timeframes.
Parabolic RSI combines Parabolic SAR with Relative Strength Index to identify momentum shifts and potential trend reversals using a unique diamond-based signal system.
The Commitment of Traders (COT) report analyzes market positions of commercial, large, and small traders to provide strategic trading insights and market sentiment.
A customizable Bollinger Band Percentile toolkit that identifies market overbought and oversold conditions with flexible moving average and deviation calculation options.
A trading signal using moving average gaps and average true range to identify breakout moves and potential entry/exit points with multiple filtering mechanisms.
COT index reveals market sentiment by tracking net positioning of smart money traders in futures markets over a 26-week period using data from the Commodity Futures Trading Commission.
A dynamic RSI variant using Lévy Flight modeling to enhance momentum detection by dynamically weighting price changes with improved responsiveness and trend sensitivity.
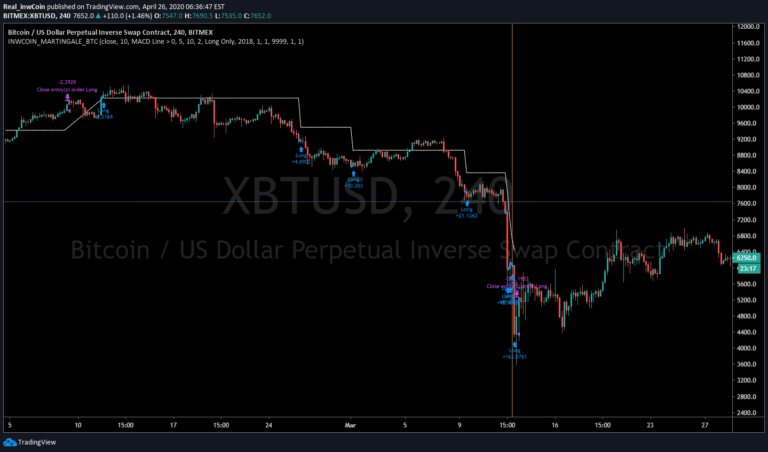
A risky trading strategy involving progressively doubling down on losing trades to recover losses, potentially generating high returns but with extreme portfolio risk.
An advanced RSI divergence indicator that identifies potential market reversals by comparing price action to RSI indicator movements, highlighting both small and big divergence signals.
A scalping indicator that combines candlestick pattern recognition with dynamic risk management to generate precise entry and exit signals for short-term trading strategies.
Likes, views, and comments are historical TradingView snapshots. They describe attention, not trading performance.